
- BNB has fallen below the $10 handle once again as BTC drops back below $6,300.
- The market is trading within a range between $9 and $10.99.
- Expected Support: $9.24, $9.00, $8.50, $8.20, $7.00, $6.57.
- Expected Resistance: $10.12, $10.99, $12.22, $13.45, $16.18.
Binance Coin has fallen back below $10 after seeing a decline of up to 7.3% in the previous 24 hour trading session. The BNB cryptocurrency which allows users to receive discounts on trading fees is presently swapping hands at a price of $9.57 on exchanges.
The 15-month old cryptocurrency is ranked 14th in terms of overall market cap with a total market cap value of $1.12 billion. After suffering a slight 22% price fall over the last 90 trading days, BNB/USD is trading at a value that is only 60% lower than its all-time high price.
For more information on how to trade on the world’s leading exchange by volume, we recommend “How To Use Binance Exchange: A Beginner’s Guide”.
Binance Coin Price Analysis
BNB/USD – LONG TERM – DAILY CHART
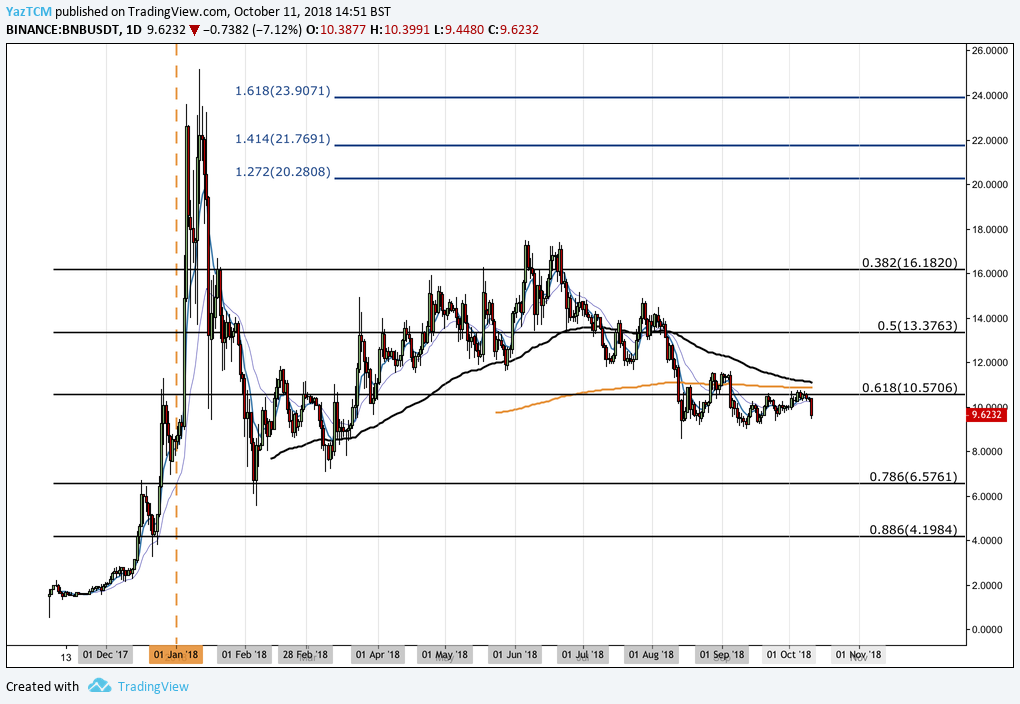
When we look at the BNB/USD market from the long-term outlook above, we immediately notice the late-2017 bull run which has a price increase totaling over 1500%. This occurred when price action began from $1.34 on November 12, 2017 and steam-rolled to an all-time high (ATH) price of $25.18 on January 12, 2018.
We can see that BNB/USD then started to decline until finding support at the long-term .786 Fibonacci Retracement level priced at $6.57 during February 2018. The market rebounded from this level of support and hasn’t returned ever since.
Let us continue to analyze price action for the market from a shorter time frame and highlight any potential support and resistance areas moving forward.
BNB/USD – SHORT TERM – DAILY CHART
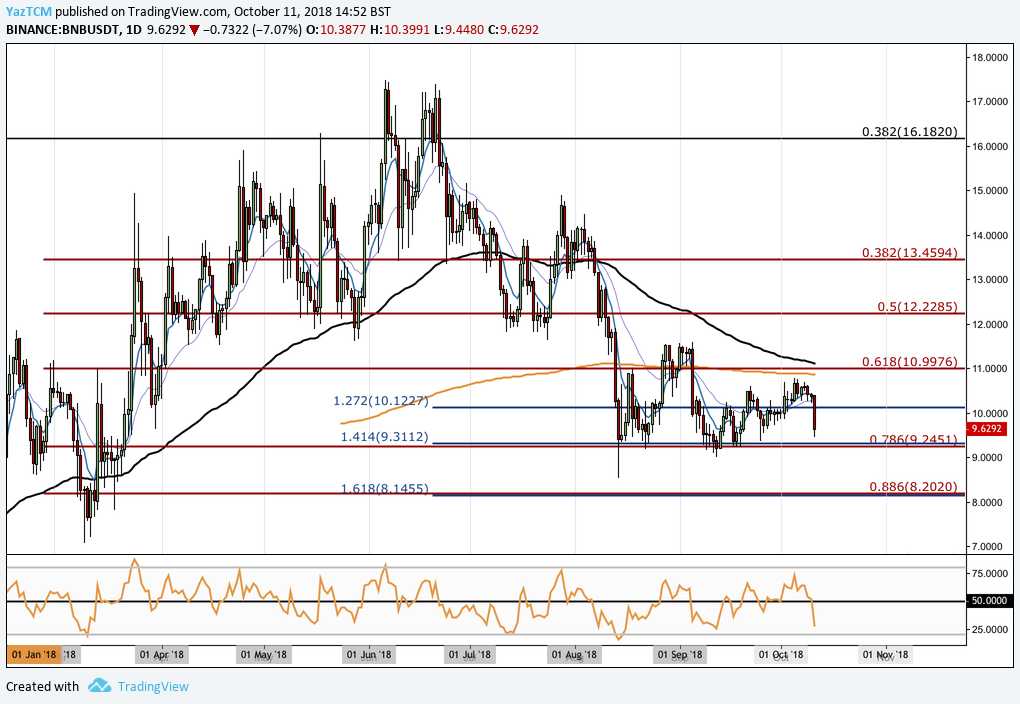
Evaluating BNB/USD from a closer perspective, we can see that the market had established another bullish run starting in March which totaled a price increase of 145%. Price action began at a low of $7.06 on March 9, 2018 and rallied to a high of $17.47 before meeting resistance on June 6, 2018.
We can see that during July 2018, as the market was falling, it had found some short-term support at the .5 Fibonacci Retracement level (drawn in red) priced at $12.22. This short-term Fibonacci Retracement is measured from the bullish run from March through June.
As the market-wide bloodbath of August 2018 unfolded, BNB/USD fell further until finding support at the short-term .786 Fibonacci Retracement level (drawn in red) priced at $9.45. This area of support was significantly strengthened by a downside 1.414 Fibonacci Extension level (drawn in blue) priced in the same location.
Over the past 6 trading weeks, BNB/USD has established a trading range bound between the $10.99 handle as the upper boundary and the $9.00 handle as the lower boundary.
Moving forward, if the bears persist with their momentum and drive BNB/USD lower, we can assume the first support level to be located at the short-term .786 Fibonacci Retracement level priced at $9.24, followed by the lower boundary of the trading range at $9.00.
If the sellers remain dominantly active and push the market below the lower boundary of the range, we can expect more resistance lower at $8.50, followed by support provided by the short-term .886 Fibonacci Retracement level priced at $8.20. This level of support is further bolstered by the downside 1.618 Fibonacci Extension level priced in the same area.
Alternatively, if the bulls can reassemble and push BNB/USD higher, we can expect the initial level of resistance to be located at the downside 1.272 Fibonacci Extension level priced at $10.12. We can presume further higher resistance to be located at the .618 Fibonacci Retracement level priced at $10.99.
Resistance at $10.99 will require significant momentum for BNB/USD to break above due to the confluence of the 100 and 200-day moving averages located above and below the $10.99 handle.
The RSI technical indicator has started to produce readings that are in line with the bears’ expectations. It is trading well below the 50 handle, indicating that the bears are in full control within the market. For a sign that the bearish momentum is fading, we will look for the RSI to make its way back toward the 50 handle.
Let us continue to analyze price action for BNB relative to BTC over the recent period and present any potential support and resistance areas.
BNB/BTC – SHORT TERM – DAILY CHART
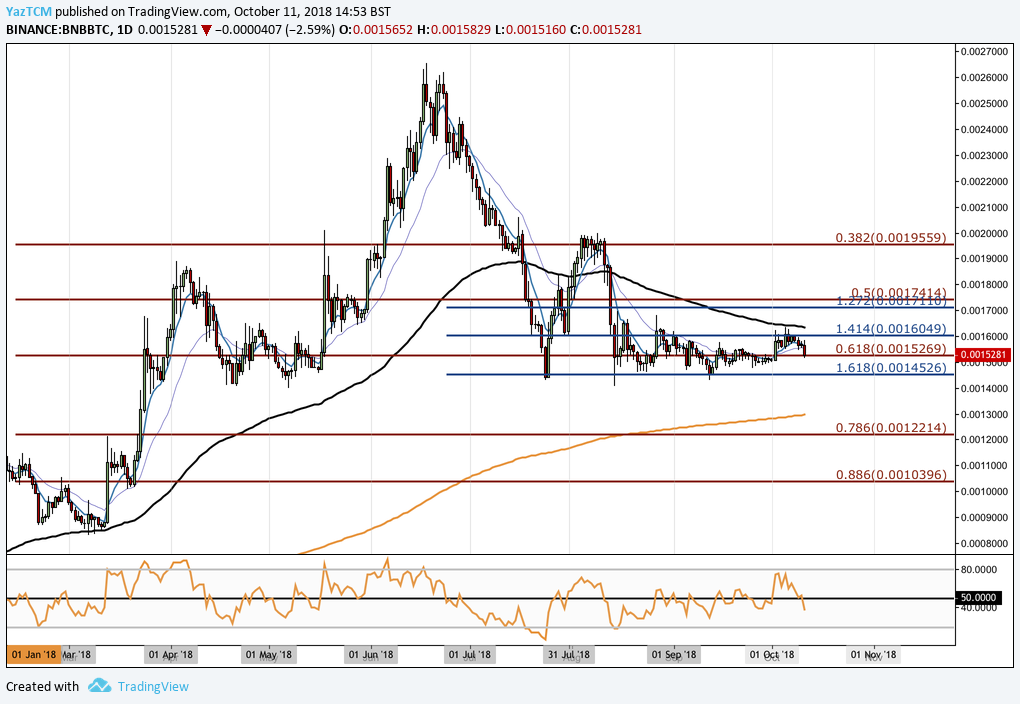
Inspecting price action for BNB/BTC we can see the bullish run which totaled a 210% price increase. The market began at a low of 8,505 SATS and increased to a high of 26,555 SATS.
BNB/BTC has since diminished to find support just below the .618 Fibonacci Retracement, at a downside 1.618 Fibonacci Extension level priced at 14,526 SATS. As the market reached this area of support, it reversed and rebounded. Price action has remained above this support level for the previous 3 months.
We can see that BNB/BTC has also established a 6-week trading range bound between 16,049 SATS as the upper boundary and 14,526 SATS as the lower boundary.
BNB/BTC is now presently trading at support provided by the .618 Fibonacci Retracement level priced at 15,269 SATS. If the sellers manage to push the market below this level of support, we can expect further support below at the lower boundary of the trading range at 14,526 SATS.
Alternatively, if the buyers can regroup and push BNB/BTC higher, we expect the first level of resistance to be located at the upper boundary of the trading range at 16,049 SATS. The 100-day moving average is hovering closely above the upper boundary at a price of 16,346 SATS.
If the bulls can progress above the 100-day moving average, further resistance higher can be expected at the .5 Fibonacci Retracement level priced at 17,414 SATS, followed by the .382 Fibonacci Retracement level priced at 19,559 SATS.
Related: Binance’s First Year Review and What It Means for BNB