
- BCH/USD has recently seen a price surge as the November 15 hard fork approaches.
- Binance has announced their support of the upcoming fork as they give notice to their customers to prepare their wallets.
- Support moving forward: $542.10, $520.50, $499.10, $477.70, $447.20, $429.00, $420.60, $406.90, $400.
- Resistance moving forward: $578.40, $600, $641.40, $667.40, $704.80, $715.60.
Bitcoin Cash has seen an impressive 31.86% increase in price over the past 7 trading days as the cryptocurrency now trades at a price around $553.17, at the time of writing. This increase in price has largely been attributed to the upcoming hard fork scheduled for November 15, 2018 and the recent announced support for the fork provided by Binance.
Bitcoin Cash (BCH) is now in 4th position in market cap rankings, with a total market cap value of $9.65 billion. The recent price increase has started to erase some of the losses incurred over the last few months as the 90-day value change now stands at a 21.67% loss.
The 15-month old project is presently trading at a value that is 86% lower than its all-time high (ATH) price.
Let us continue to analyze price action for BCH/USD and BCH/BTC and highlight potential areas of support and resistance moving forward.
Bitcoin Cash Price Analysis
BCH/USD – LONG TERM – DAILY CHART
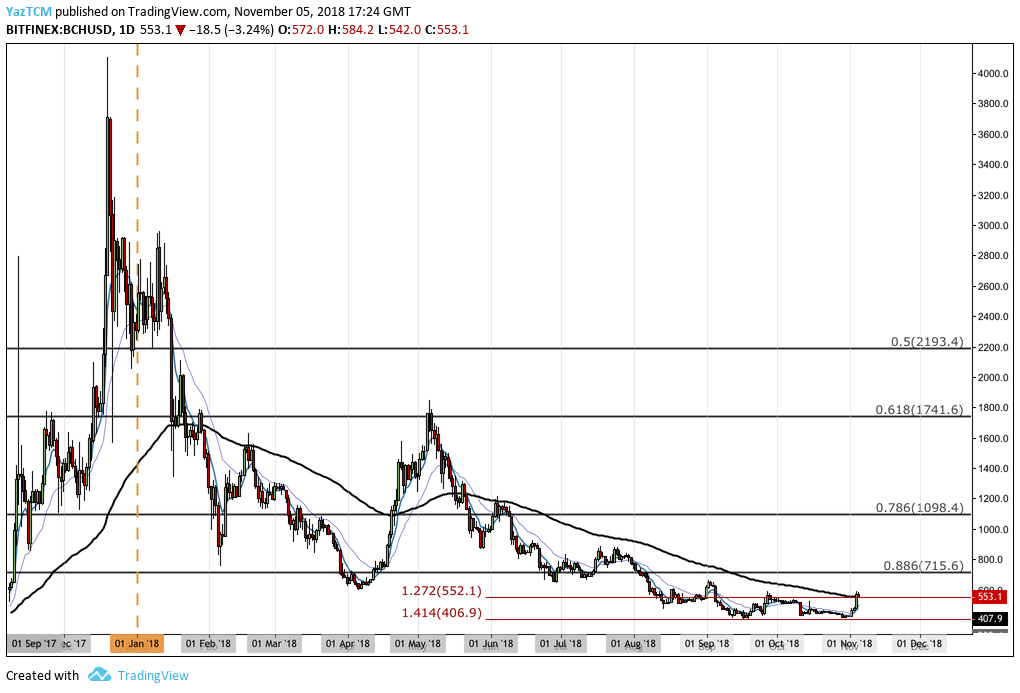
Taking a brief look at BCH/USD over the long term, we can see that after placing the ATH of $4,104 during December 2017, the market has consistently fallen throughout the 2018 trading year.
The BCH/USD decline had recently found support at a downside 1.414 Fibonacci Extension level priced at $406.90 during September 2018. This price level continued to provide support during October 2018, preventing BCH/USD from dipping further lower.
Let us take a closer look at BCH/USD over the last few months and highlight some potential areas of support and resistance moving forward.
BCH/USD – SHORT TERM – DAILY CHART
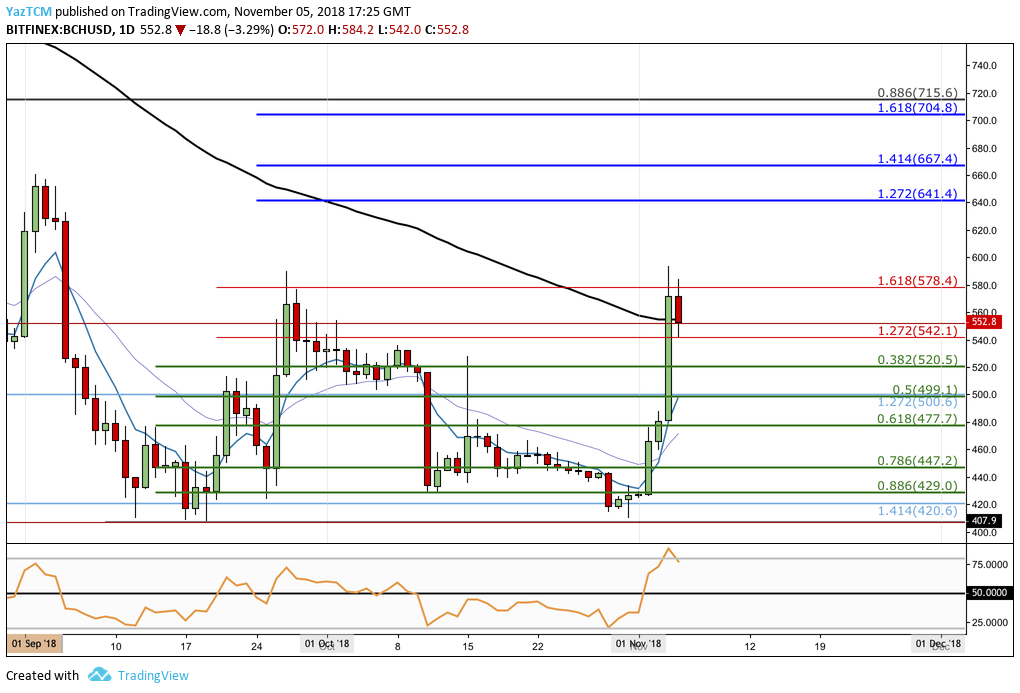
Upon viewing BCH/USD from a closer overview, we can see that price action had found further support at a shorter-term downside 1.414 Fibonacci Extension level (drawn in light blue) priced at $420.60. As BCH/USD reached this area of combined support, the market reversed and began to rise.
Price action had risen a total of 44% during September 2018. The market began at a low of $407.90 on September 19, 2018 and extended to a high of $590 on September 27, 2018.
As the market reached the high, it met resistance at a short-term 1.618 Fibonacci Extension level (drawn in red) priced around $578.40. We can see that price action had recently made a re-test of this resistance level in the last trading session and failed to break above, which has resulted in the market pulling back slightly.
Moving forward, in our bearish scenario, if the market continues to retrace below the support at the short-term 1.272 Fibonacci Extension level (drawn in red) priced at $542.10 we can expect immediate support below to be located at the .382 Fibonacci Retracement level (drawn in green) priced at $520.50.
If the sellers continue to drop BCH/USD further lower, then more support can be expected at the short-term .5 and .618 Fibonacci Retracement levels (drawn in green), priced at $499.10 and $477.70 respectively.
If the bearish pressure continues to drive price action even lower, more support beneath can be expected at the .786 and .886 Fibonacci Retracement levels priced at $447 and $429, followed by the September 2018 price low at $407.
Alternatively, in our bullish scenario, if the buyers can cause BCH/USD to climb up above the $600 handle, we can expect higher resistance to initially be located at the 1.272 and 1.414 Fibonacci Extension levels, (drawn in dark blue) priced at $641 and $667 respectively.
Higher resistance above this can then be located at the 1.618 Fibonacci Extension level priced at $704, followed by the previous long-term .886 Fibonacci Retracement level (drawn in black) priced at $715.
The RSI indicator is producing a reading that heavily favous the bulls at this moment in time. However, the RSI is trading in overbought conditions which indicates that the market may need to pull back slightly further before the buyer can drive the price higher once again.
So long as the RSI remains above the 50 handle, we can expect this market to continue to make higher gains.
Let us continue to analyze price action for BCH/BTC over the long term.
BCH/BTC – LONG TERM – DAILY CHART
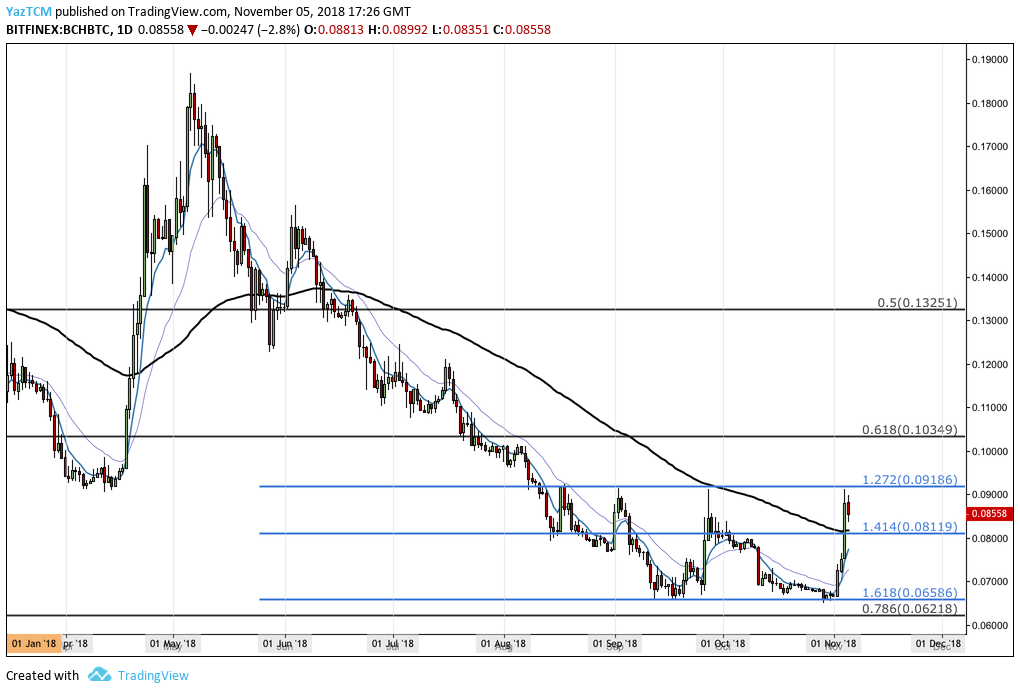
The long term overview for BCH/BTC shows a similar story to that of BCH/USD. The market has been persistently declining throughout the year, until finding support at a downside 1.618 Fibonacci Extension level priced at 0.06586 SATS.
For the past 2 months, price action has been trapped between a very wide range between the downside 1.272 and 1.618 Fibonacci Extension levels, priced between 0.09186 SATS and 0.06586 SATS.
Let us continue to focus on price action over the more recent period and highlight any areas of potential support and resistance.
BCH/BTC – SHORT TERM – DAILY CHART
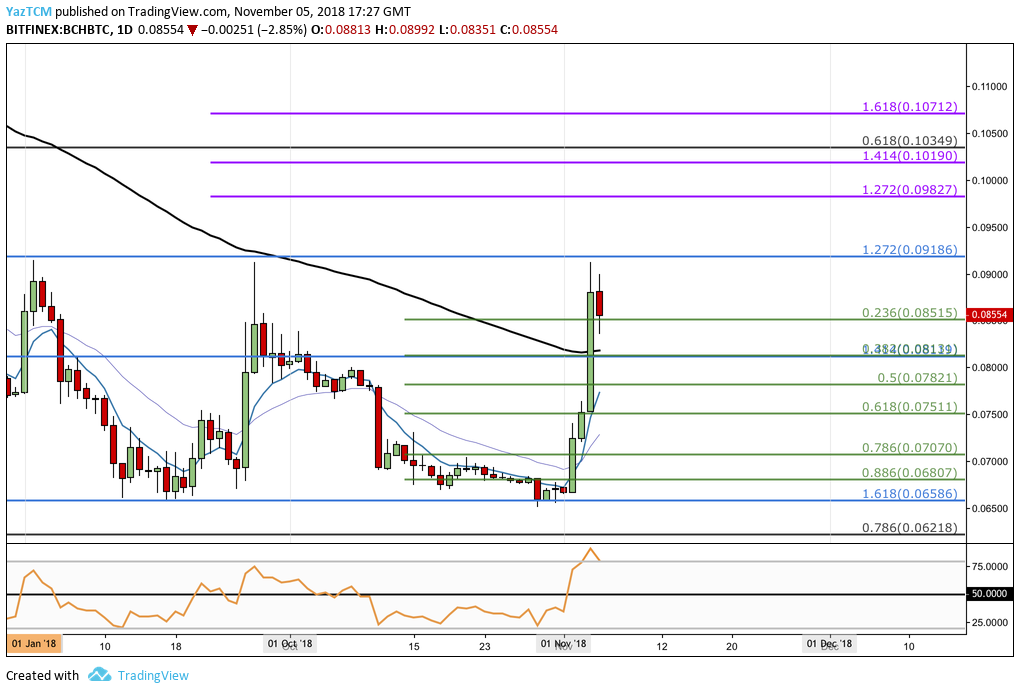
Analyzing the market from a closer time horizon, we can see that BCH/BTC had seen a recent price surge. The market started from a low of 0.06588 SATS on October 29, 2018 and rose to a high of 0.09129 on November 4, 2018. This was a total increase of 40% from low to high in BCH/BTC.
Price action has pulled back slightly to where it now trading at support provided by the short-term .236 Fibonacci Retracement level (drawn in green) priced at 0.08515 SATS.
Looking ahead, in our bearish scenario, if the sellers push the market below the support at 0.08515 SATS, we can expect further support beneath to be located at the .382 and .5 Fibonacci Retracement levels (drawn in green), priced at 0.08139 SATS and 0.07821 SATS respectively.
If the bearish pressure continues to drive price action even further lower, then more support beneath can be expected at the .618 Fibonacci Retracement level (drawn in green) priced at 0.07511 SATS, followed by the .786 and .886 Fibonacci Retracement levels (drawn in green) priced at 0.07070 SATS and 0.06807 SATS respectively.
The final level of support located lower can be expected at the October 2018 low and the long-term downside 1.618 Fibonacci Extension level priced at 0.06586 SATS.
On the other hand, in our bullish scenario, if the buyers can manage to break price action above the resistance at the 0.09186 SATS handle, we can expect further higher resistance to be located at the 1.272 and 1.414 Fibonacci Extension levels (drawn in purple), priced at 0.09827 SATS and 0.10190 SATS respectively.
Higher resistance above this can then be expected at the long-term .618 Fibonacci Retracement level (drawn in black) priced at 0.10349 SATS, followed by the 1.618 FIbonacci Extension level (drawn in purple) priced at 0.10712 SATS.