
Download the Brave Browser.
- BAT has continued to surge as Coinbase Pro begins full trading services for the token today.
- BAT is now trading above $0.30 after seeing a 30-day price increase totaling a 76%.
- Support moving forward: $0.2936, $0.2731, $0.2623, $0.2370, $0.2117, $0.1766, $0.1543, $0.1393, $0.1304.
- Resistance moving forward: $0.3421, $0.3631, $0.3933, $0.40, $0.4354, $0.50, $0.5494.
Basic Attention Token (BAT) has witnessed a 7-day price increase totaling a remarkable 25% as the cryptocurrency presently trades at a price around $0.3096.
The market has continued to rise since our last analysis on BAT, which was written after the Brave team had released their updated web browser. We had also mentioned rumors that BAT could be the next coin to be added to Coinbase. It seems the rumor has been realized as BAT recently started trading on Coinbase Pro, a move that further spurred the bulls.
The BAT project is currently ranked 30th in market cap. It presently holds a total market cap value of around $303 million, after seeing an impressive 30-day price hike totaling 76%.The 17-month old coin is now trading at a value that is 64% lower than its all-time high price.
Let us continue to analyze price action for BAT/USD over the long term and gauge the market behavior.
BAT Price Analysis
BAT/USD – LONG TERM – DAILY CHART
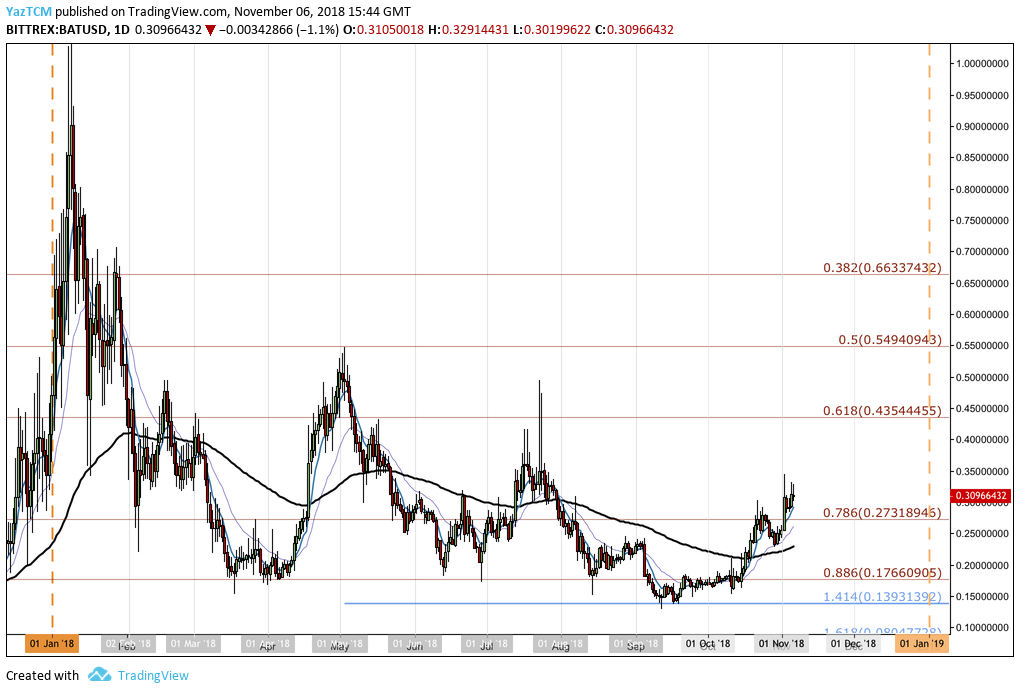
Analyzing price action from the long-term perspective, we can immediately notice that price action has been continuously suppressed by the sellers throughout the majority of the trading year.
The overall downtrend had recently came to a stop when the market reached support at a downside 1.414 Fibonacci Extension level (drawn in blue) priced at $0.1393 during September 2018. BAT/USD reversed its downtrend at this area, creating the recent price surge from this support.
Let us continue to look at price action a little closer over the past 3 months and highlight potential areas of support and resistance moving forward.
BAT/USD – SHORT TERM – DAILY CHART
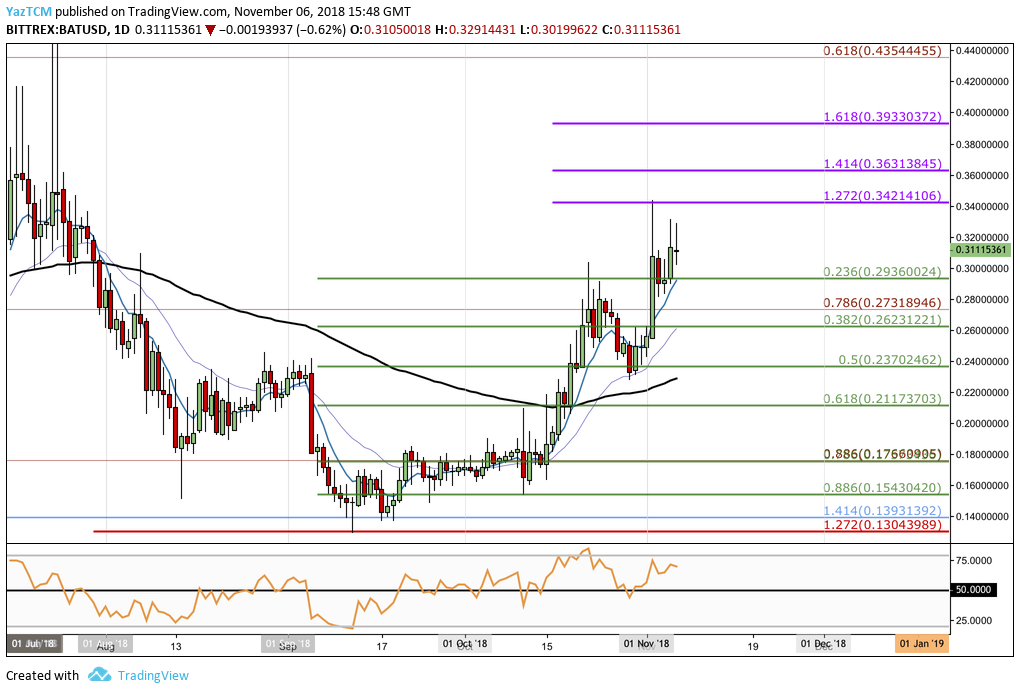
Upon closer inspection of BAT/USD from a shorter time horizon, we can see that the support at the downside 1.414 FIbonacci Extension level (drawn in blue) was further strengthened by another shorter-term 1.272 Fibonacci Extension level (drawn in red) priced at $0.1304.
As BAT/USD approached this area of combined support, the buyers stepped back into the market, preventing price action from dipping further lower. Price action went on to surge, beginning at a low of $0.1290 on September 12, 2018 and continuing to a high of $0.3437 on October 12, 2018. This created a price increase totaling 165% from low to high.
As BAT/USD reached the high, it met resistance at a short-term 1.272 Fibonacci Extension level (drawn in purple) priced at $0.3421 before rolling over. We can see that BAT/USD has pulled back to the short-term .236 Fibonacci Retracement level (drawn in green) priced at $0.2936.
Moving forward, in our bullish scenario, if the buyers can continue with their momentum and cause BAT/USD to climb above resistance at $0.3421, we can expect further higher resistance to be located at the short-term 1.414 and 1.618 Fibonacci Extension levels (drawn in purple), priced at $0.3631 and $0.3933 respectively.
If the bullish momentum continues to pressure price action higher, we can then expect further resistance above to be located at the long-term .618 Fibonacci Retracement level (drawn in red) priced at $0.4354, followed by the long-term .5 Fibonacci Retracement level (drawn in red – on previous chart) priced at $0.5494.
Alternatively, in our bearish scenario, if the sellers push price action for BAT/USD below the support at $0.2936, we can expect immediate support below to be found at the short-term .382 and .5 Fibonacci Retracement levels (drawn in green), priced at $0.2623 and $0.2370 respectively.
If the sellers continue to drive price action further lower, we can expect more support beneath to be located at the .618 and .786 Fibonacci Retracement levels (drawn in green), priced at $0.2117 and $0.1766 respectively.
In the case that the sellers continue even further lower, our last 2 levels of support are located at the previous downside 1.272 Fibonacci Extension level (drawn in blue) priced at $0.1393, followed by the September 2018 low priced at $0.1290.
The RSI is producing a reading that heavily favors the bulls within the market as it trades above the 50 handle. So long as the RSI remains above 50, we could expect to see BAT/USD travel higher.
Let us continue to analyze price action for BAT/BTC over the long term and gain a perspective for the BAT market relative to BTC.
BAT/BTC – LONG TERM – DAILY CHART
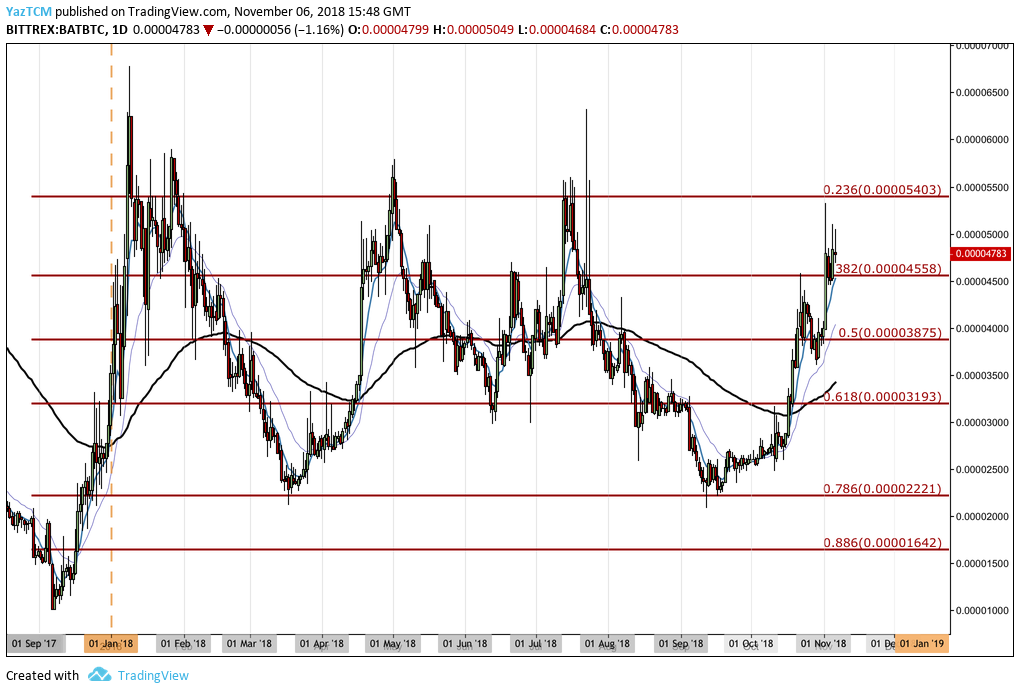
Looking at the long-term overview for BAT/BTC, we can see that the market has had a year of rollercoaster-type price movements, swinging wildly between 2,221 SATS and 5,500 SATS.
The market found strong support at the .786 Fibonacci Retracement level priced at 2,221 SATS during March 2018 and September 2018. The market has not been able to break below this strong support level all year long.
BAT/BTC is now trading above support at the .382 FIbonacci Retracement level priced at 4,558 SATS as the market gears to challenge the 5,500 SATS handle once again.
Let us continue to look at price action a little closer over the short term and highlight any areas of potential support and resistance moving forward.
BAT/BTC – SHORT TERM – DAILY CHART
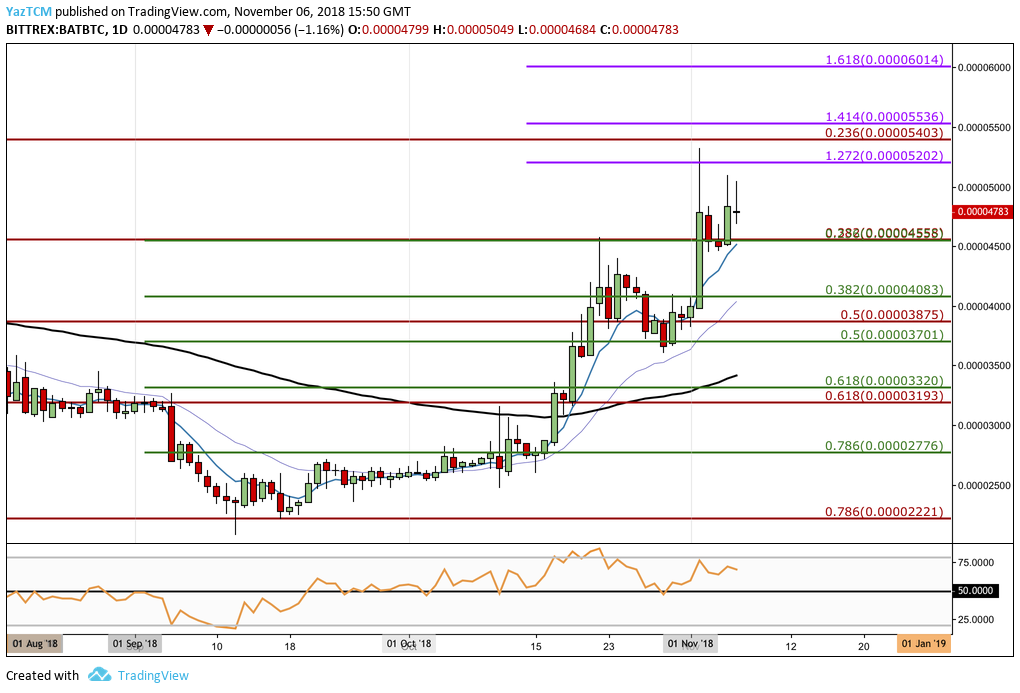
Inspecting BAT/BTC a little closer, we can see that the price surge began at a low of 2,880 SATS on September 12, 2018 and extended to a high of 5,325 SATS on November 2, 2018 creating a total price surge of 152%.
The market was rejected at the high as it met resistance provided by the short-term 1.272 Fibonacci Extension level (drawn in purple) priced at 5,202 SATS.
Moving forward, if the bulls can break above the resistance at 5,202 SATS, we can expect immediate resistance above to be located at the long-term .236 Fibonacci Retracement level priced at 5,403 SATS, followed by the short-term 1.414 FIbonacci Extension level (drawn in purple) priced at 5,536 SATS.
If the bullish pressure persists to drive price action higher, we can expect further resistance above to be located at the 1.618 Fibonacci Extension level (drawn in purple), priced at ,6014 SATS.
On the other hand, in our bearish scenario, if the sellers drive price action lower, we can expect immediate significant support beneath to be located at the short-term .236 Fibonacci Retracement level (drawn in green) priced at 4,558 SATS. This area of support is further bolstered by the long-term .382 Fibonacci Retracement level (drawn in red) priced in the same area.
If the sellers continue to drive BAT/BTC lower, then we can expect more support beneath to be located at the .382 and .5 Fibonacci Retracement levels (drawn in green), priced at 4,083 SATS followed by 3,701 SATS. Further support beneath this can then be expected at the .618 and .886 Fibonacci Retracement levels (drawn in green), priced at 3,320 SATS and 2,776 SATS.
Download the Brave Browser.