
- Bancor has recently rebounded from support at $1.27 during October 2018 to where it is currently trading at $1.41.
- For the past 2 months, the market has been trading within a wide range between $1.10 and $1.67.
- Support moving forward: $1.39, $1.33, $1.27, $1.20, $1.15, $1.10, $1.00.
- Resistance moving forward: $1.45, $1.50, $1.67, $1.77, $1.84, $1.95, $2.00, $2.07.
Bancor has witnessed a small 2.2% price increase over the previous 24-hour trading session. The cryptocurrency is presently trading at a price around $1.41 after witnessing a further 7.15% price hike over the past 7 trading days.
Bancor is ranked 70th in terms of overall market cap and currently holds a total market cap value of $91.14 million. The project has seen a turbulent 90-day trading period where price action has dropped a steep 22%.
The 17-month old coin is now exchanging hands at a price that is 86% lower than the all-time high price.
Let us continue to analyze Bancor over the long term and assess market behavior.
Bancor Price Analysis
BNT/USD – LONG TERM – DAILY CHART
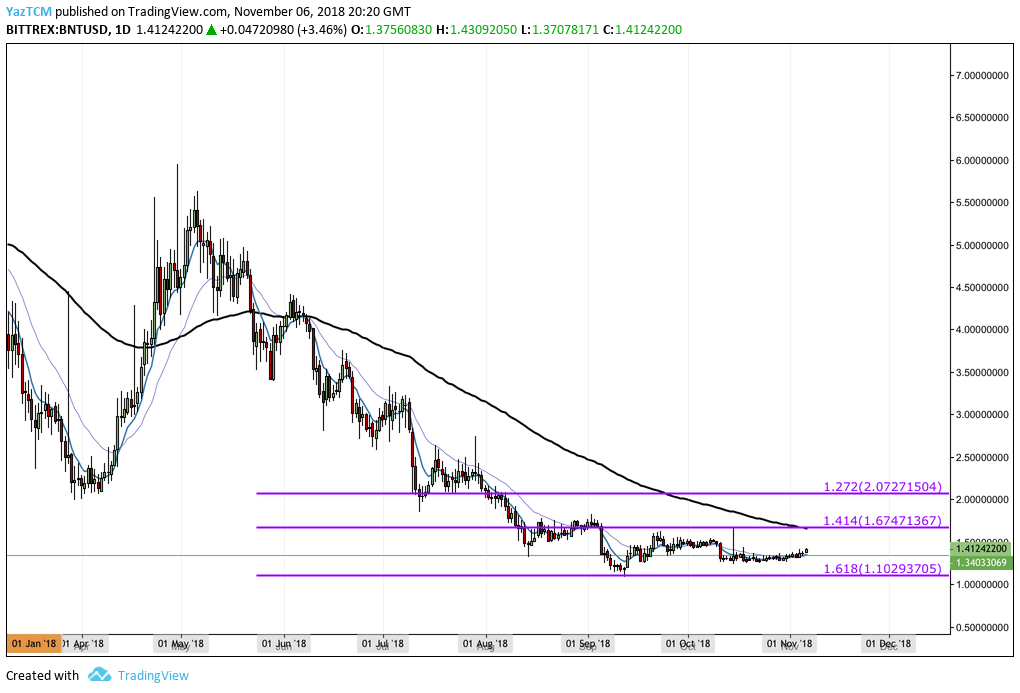
Looking at BNT/USD over the long-term perspective above, we can see that price action has constantly been suppressed over the course of the trading year. The downtrend has recently found a form of stabilization as price action found support at a downside 1.618 Fibonacci Extension level priced at $1.10 during Septmeber 2018.
We can see that since reaching the level of support, BNT/USD has been trapped between a trading range bound between the 1.414 and 1.618 Fibonacci Extension levels, priced at $1.67 and $1.10 respectively.
Let us continue to analyze price action a little closer and highlight any areas of potential support and resistance.
BNT/USD – SHORT TERM – DAILY CHART
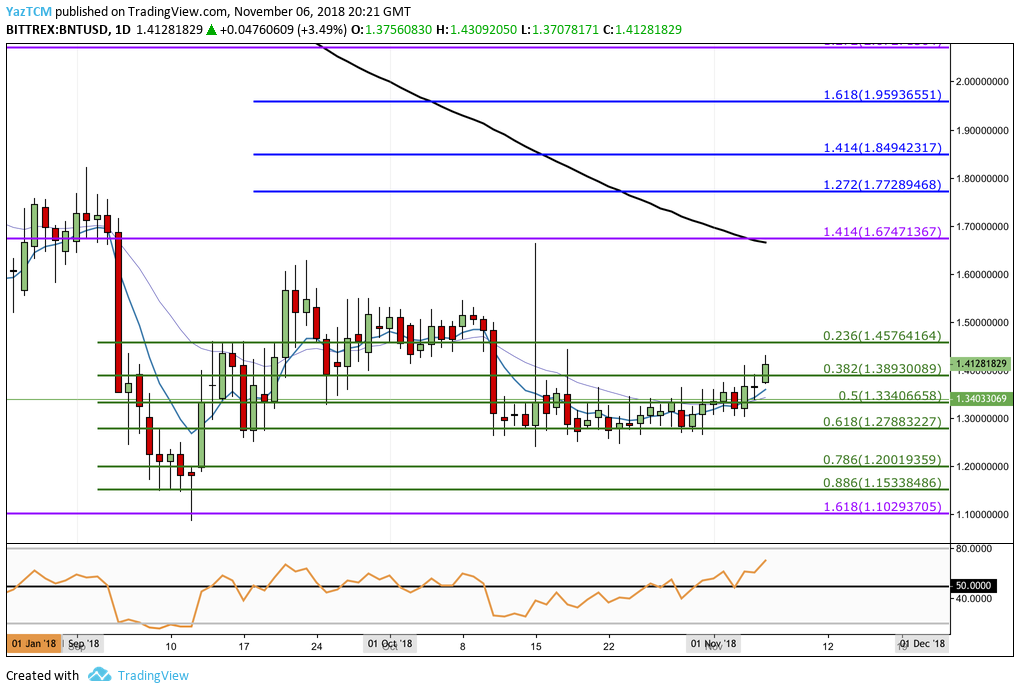
Analyzing market action from a closer viewpoint, we can see that BNT/USD had experienced a recent price hike totaling 50%. Price action started at a low of $1.08 on September 12, 2018 and extended to a high of $1.62 on September 23, 2018.
After placing the high, the market rolled over and started to decline. BNT/USD had found strong support at the short-term .618 Fibonacci Retracement level priced at $1.27 during October 2018. The market remained strongly supported by this level for the majority of October 2018, not letting price action drop further below the support.
Over the first few days of trading in November 2018, price action has started to rise up above the identified support. BNT/USD is now trading above the .382 Fibonacci Retracement level priced at $1.38.
Moving forward, in our bullish scenario, if the buyers continue to purchase, they will meet resistance at the .236 Fibonacci Retracement level priced at $1.45. If the bulls continue to break up above the September 2018 high priced at $1.62, we can expect further higher resistance to be located at the previous downside 1.414 Fibonacci Extension level (drawn in purple) priced at $1.67.
This area of resistance also contains the 100-day moving average level which further adds to the strength of the resistance.
If the buyers can continue to climb above the 100-day moving average, we can expect higher resistance to be located at the short-term 1.272 and 1.618 Fibonacci Extension levels (drawn in blue), priced at $1.77 and $1.95 respectively.
Alternatively, in our bearish scenario, if the sellers re-enter the market and begin to drive price action below the support at the .382 Fibonacci Retracement level priced at $1.38, we can expect immediate significant support beneath to be located at the .5 and .618 Fibonacci Retracement levels, priced at $1.33 and $1.27 respectively.
If the sellers continue to pressure price action below the support at $1.27, we can then expect further lower support to be located at the .786 and .886 Fibonacci Retracement levels, priced at $1.20 and $1.15 respectively. If the bearish action continues even lower, then more support can be located at the previous downside 1.618 Fibonacci Extension level (drawn in purple) priced at $1.10.
The RSI has been climbing over the past month and has recently broken up above the 50 handle. This indicates that the bulls are starting to gain control of the market momentum. If the RSI continues to rise, we can expect this market to head higher.
Let us continue to analyze price action for Bancor relative to Bitcoin over the short term and highlight some potential areas of support and resistance.
BNT/BTC – SHORT TERM – DAILY CHART
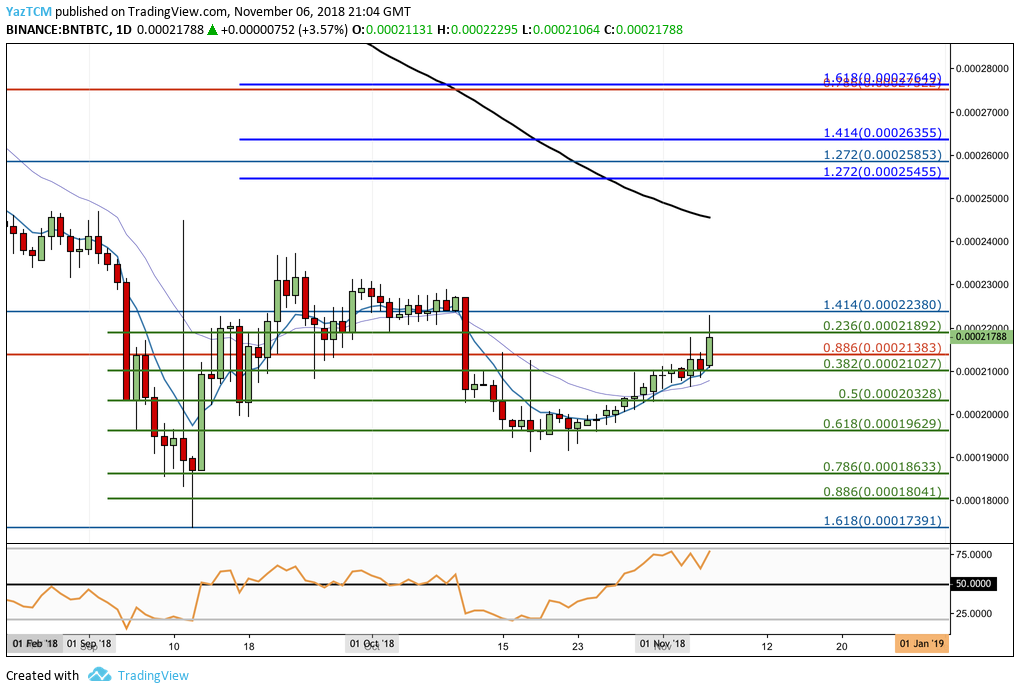
Analyzing market action for Bancor against Bitcoin, we can see that price action had found support at a downside 1.618 Fibonacci Extension level priced at 17,391 SATS during September 2018. From this level of support, price action went on to reverse and created a high up until it met the 23,678 SATS handle.
The market then went on to decline, until it found further support below at the .618 Fibonacci Retracement level, priced at 19,629 SATS during October 2018. Price action is now trading at resistance provided by the .236 Fibonacci Retracement level priced at 21,892 SATS.
Moving forward, if the bears re-enter the market and push price action lower, we can expect immediate support below to be located at the .382 and .5 Fibonacci Retracement levels, priced at 21,027 SATS and 20,328 SATS respectively.
Further strong support below this can then be expected at the .618 Fibonacci Retracement level priced at 19,629 SATS.
If the sellers eventually continue to penetrate below the .618 Fibonacci support, we can look toward the .786 and .886 for further support, priced at 18,633 SATS and 18,041 SATS respectively.
Alternatively, in our bullish scenario, if the buyers can drive price action above the resistance at the 21,892 SATS handle, they will initially encounter higher resistance at the previous downside 1.414 Fibonacci Extension level, priced at 22,380 SATS.
If the bulls can then continue to break up above the September 2018 high at 23,678 SATS, we will look for higher resistance above to be located at the short-term 1.272 and 1.414 Fibonacci Extension levels (drawn in dark blue), priced at 25,455 SATS and 26,355 SATS respectively.
The final level of resistance above to highlight is the 1.618 Fibonacci Extension level (drawn in dark blue), priced at 27,649 SATS.
The RSI is also favoring the bulls within this market. However, the RSI here is printing a reading that suggests the bulls are fully in control of the momentum as it trades near overbought conditions. If the bullish momentum would like to continue higher, the market may need to pull-back slightly before being able to travel higher.