0x has experienced a 5.66% drop in price over the past 24 hours of trading. The protocol coin is currently exchanging hands at $1.07, and has seen a small price decline totaling 4.86% over the past 7 trading days.
0x is a decentralized protocol that allows ERC-20 tokens to be traded without the need for a centralized exchange. The project was founded in October 2016 by Will Warren and Amir Bandeali.
0x is different to centralized exchanges as it requires no middle man to hold your funds. This eliminates the risk of theft when exchanges are hacked.
However, the 0x protocol is different to existing decentralized exchanges in the sense it does the majority of the exchanging off-chain. Typical decentralized exchanges do their exchanging on the chain, and this means that fees are applied to each and every transaction on the blockchain. This also clogs up the blockchain with orders.
0x Protocol has succeeded in creating a system that facilitates decentralized trading in a trustless manner. For more information on the 0x, please refer to our “What is 0x Protocol” guide.
0x is currently ranked 23rd in terms of overall market cap across the entire industry. The cryptocurrency has a total market cap value of $569 million. This is $455 million lower than the market cap high seen on May 10, 2018, as indicated in the graph below.
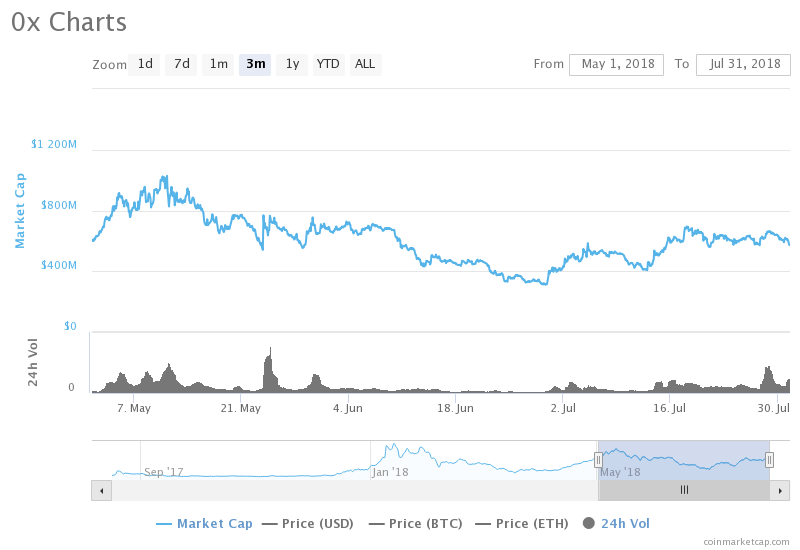
Despite the recent price drops over the past 7 trading days, 0x has experienced a significant price surge totaling 69.61% over the past 30 trading days.
Let us continue to analyze price action for 0x.
Price Analysis
ZRX/USD – LONG TERM – DAILY CHART
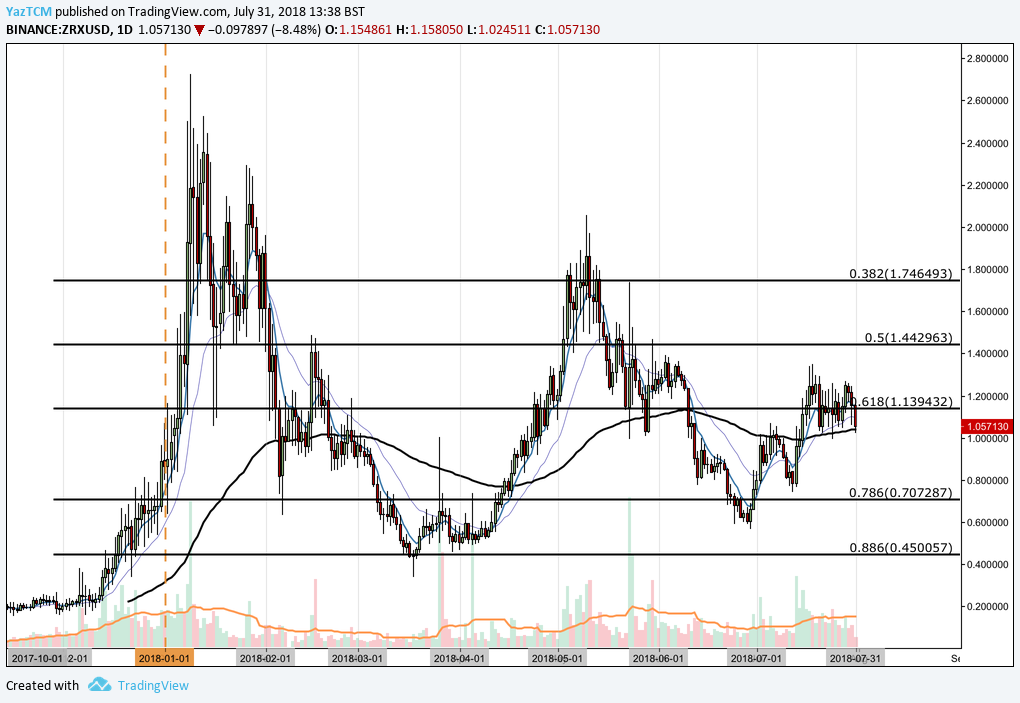
Analyzing the market from the long-term perspective above, we can see that the 0x protocol had experienced a significant bullish price run during December 2017 when price action started from a low of $0.26 on November 29, 2017 and rose to an all-time high of $2.72 on January 9, 2018. This was a price increase of 1,420% from low to high.
The market went on to depreciate after this price run, originally finding support at the .50 Fibonacci Retracement level, priced at $1.44, in January. This is a Fibonacci Retracement measured from the entire bullish run aforementioned.
The market was not able to hold this level and continued to decline below the .618 Fibonacci Retracement priced at $1.13, and consequently the 100-day moving average during February. The market continued to fall until significant support was found at the .886 Fibonacci Retracement level priced at $0.45 during March 2018.
Let us continue to analyze price action a little closer over the more recent period to highlight any potential support and resistance areas.
ZRX/USD – SHORT TERM – DAILY CHART
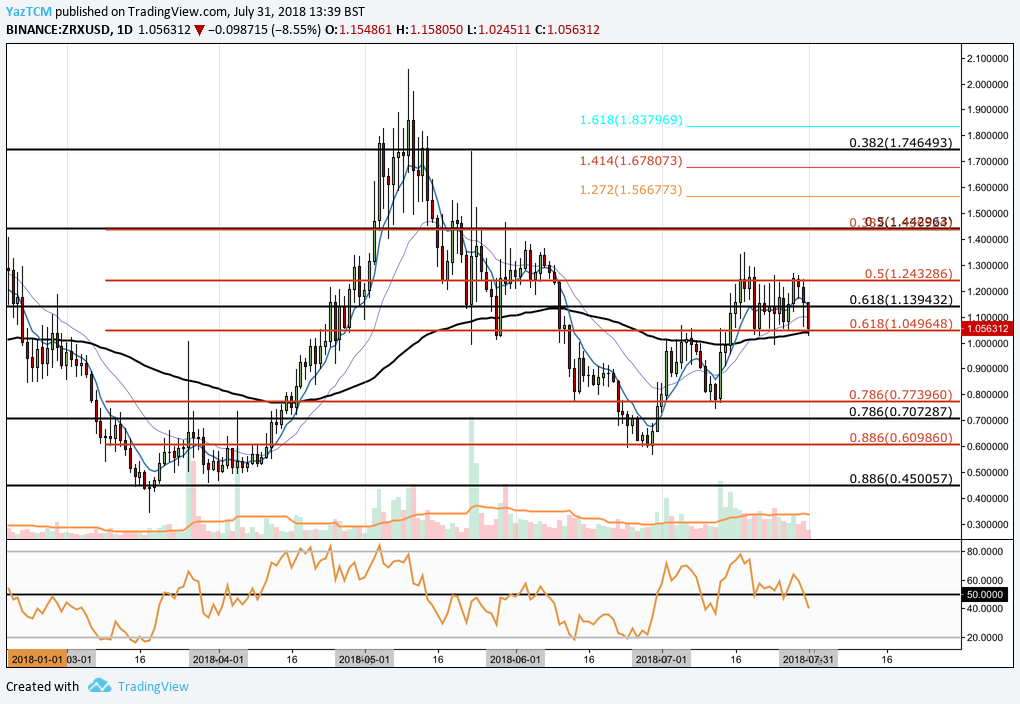
Analyzing the market from the short-term perspective above, we can see that price action had experienced another, slightly smaller, bullish run during April. During this bull run price action started from a low of $0.34 on March 18, 2018 and rose to a high of $2.05 on May 10, 2018. This was a price increase totaling 468% from low to high.
We can see that as the market rolled over, it attempted to hold above the short-term .50 Fibonacci Retracement (drawn in red) priced at $1.24, but was unable to achieve this as the market fell below the Fibbo level and the 100-day moving average once again. Price action continued to decline during June until it found support at the short-term .886 Fibonacci Retracement level priced at $0.60, where a rebound was experienced.
The market had bounced from this level and continued to appreciate by a total of 69% over the next 30 trading days during July 2018. We can see that the market had met resistance at the short-term .50 Fibonacci Retracement priced at $1.24 and failed to overcome this level.
Price action is currently trading at support marked by the short-term .618 Fibonacci Retracement priced at $1.04. This area of support is significantly bolstered by the 100-day moving average adding the expected support in this area. These two price levels, $1.24 and $1.04, mark the boundaries of the tight range that 0x has been trading within over the past 2 weeks.
If the bearish momentum continues and pushes price action below the short-term .618 Fibonacci Retracement and the 100-day moving average, then near-term support is expected at the psychological round number handle of $1.00, followed by the short-term .786 Fibonacci Retracement (marked in red) priced at $0.77. Support expected below this level is located at the short-term .886 Fibonacci Retracement priced at $0.60.
Alternatively, if the bullish pressure can re-enter the market and push price action above the .50 Fibonacci Retracement priced at $1.24, we expect near-term resistance to be located at the short-term .382 Fibonacci Retracement priced at $1.44. This area of resistance is also reinforced by the long-term .50 Fibonacci Retracement priced at the same level.
The RSI technical indicator is currently printing favor toward the bears within the market as it recently broke below the 50 handle. If we are to expect a bullish run within this market, we would need to see the RSI break back above the 50 handle once again.
Let us continue to analyze 0x price action relative to Bitcoin.
ZRX/BTC – LONG TERM – DAILY CHART
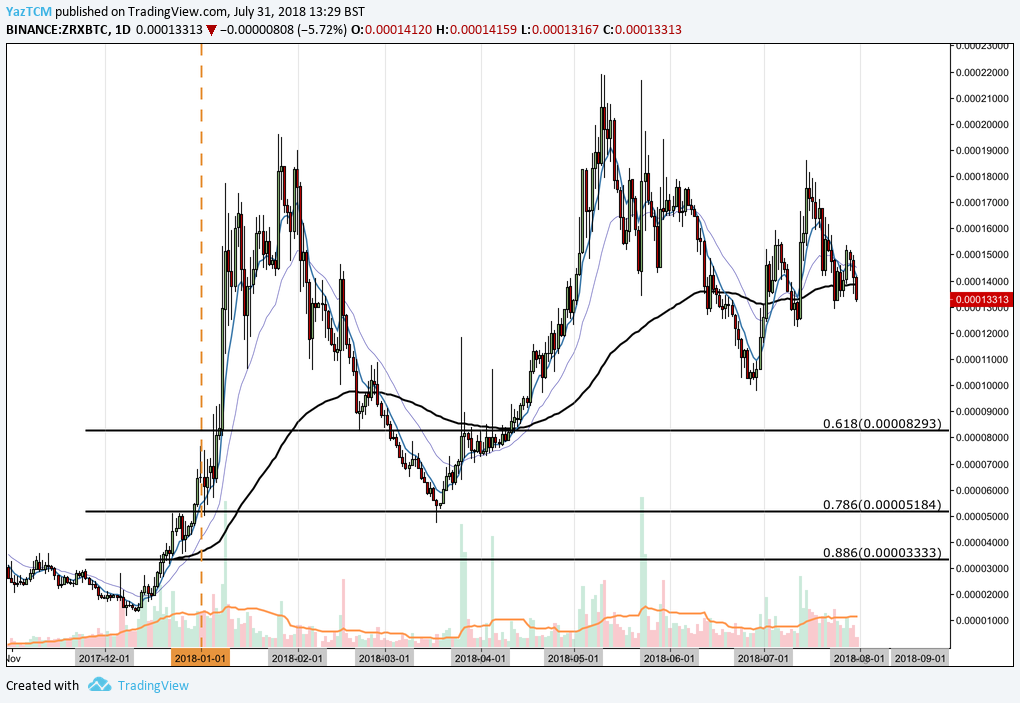
Analyzing the market relative to Bitcoin, we can see that 0x had experienced a significant bullish run against Bitcoin when price action started from a low of 1,170 SATS on December 8, 2017 and extended to a high of 19,600 SATS on January 26, 2018. This was a price increase over 1,400% from low to high.
The market went on to depreciate, falling below the 100-day moving average in February to find support at the .618 Fibonacci Retracement (measured from the bullish run outlined above) priced at 8,293 SATS. The market continued to decline until finding support and reversing at the .786 Fibonacci Retracement priced at 5,184 SATS during March 2018.
Let us continue to analyze price action a little closer over the more recent period to highlight any potential support and resistance zones.
ZRX/BTC – SHORT TERM – DAILY CHART
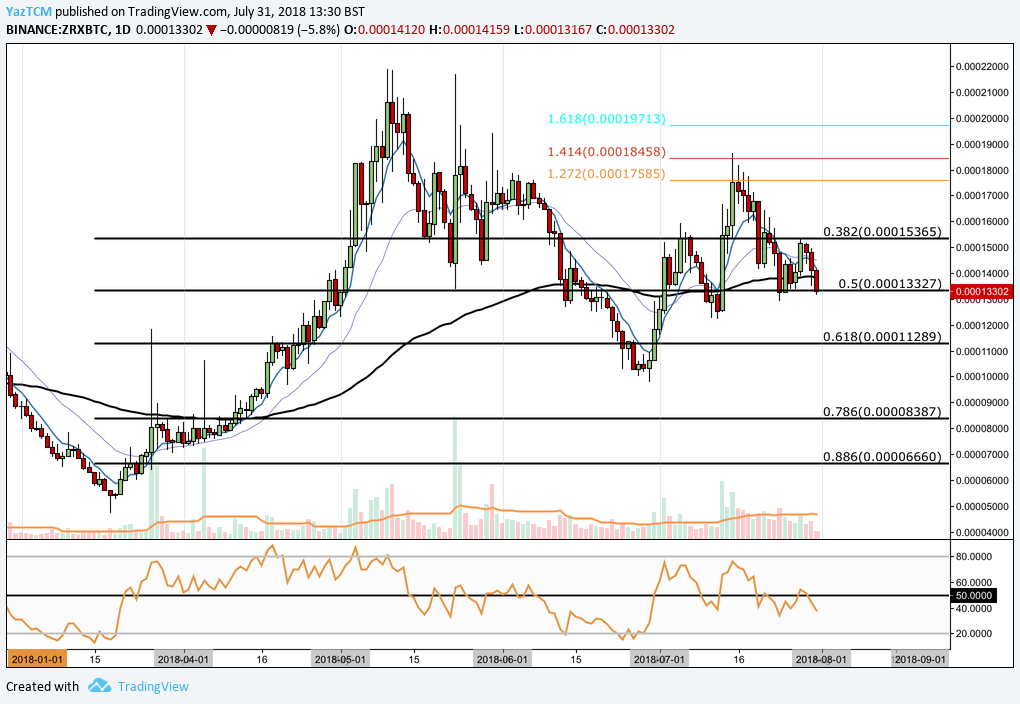
Looking at the market from the short-term perspective above, we can see that 0x continued to have another bullish run during April 2018 when price action started from a low of 4,710 SATS on March 18, 2018 and extended to an all-time high of of 21,900 SATS on May 10, 2018. This was a price increase totaling 345% from low to high.
The market had found support at the short-term .50 FIbonacci Retracement, priced at 13,327 SATS, during its decline in May but failed to hold above this as June started trading. The market fell below the short term .618 Fibonacci Retracement priced at 11,289 SATS during June, where a rebound was experienced in price action just below the 10,000 SATS level.
Price action is currently trading, once again, at support marked by the short-term .5 Fibonacci Retracement level priced at 13,327 SATS. If the bearish pressure continues, we expect the nearest level of support to be located at the short-term .618 Fibonacci Retracement priced at 11,289 SATS, followed by June 2018’s low at 9,781 SATS.
Alternatively, if the bulls can step back into the market, immediate resistance can be found at the short-term .382 FIbonacci Retracement level priced at 15,365 SATS. Resistance above this level can be expected at the 1.272 Fibonacci Extension level priced at 17,585 SATS, followed by the 1.618 Fibonacci Extension level priced at 19,713 SATS.
The technical indicators within this market are also favoring the bears slightly at this moment in time as the RSI is currently trading below the 50 handle indicating that bearish momentum is in control. If we are to expect a bullish price run, we would need to see the RSI break back above the 50 handle.