
- Ontology turned one on November 27, 2018, marking a major milestone.
- The market is trading at strong support at the $0.5199 region as price action begins to trade sideways.
- Support moving forward: $0.5199, $0.50, $0.45, $0.4091, $0.3666, $0.2950.
- Resistance moving forward: $0.60, $0.70, $0.8115, $0.9953, $1.09, $1.14.
Latest Ontology News
On November 27, 2018, the Ontology network had officially celebrated its first full year in production and what a year it has been. The high-performance blockchain, currently capable of reaching 5000 TPS, has shown a wealth of developments as well as new partnerships.
For an update on some of the partnerships that Ontology has achieved over the past year, take a look at the growing Ontology ecosystem.
Over the past few months, the team has continued to expand their partnership base as they strategically begin working with the largest GaaS (GPU-as-a-service) and cloud gaming provider in North East Asia, known as Ubitus.
Ontology has partnered with Ubitus to provide blockchain solutions which will include data exchange, data identity and smart contract solutions. It is hoped that the partnership can help Ubitus save on their AI development costs by utilizing blockchain technology.
In other Ontology news, the decentralized music platform, Muzika, is set to launch its beta in January 2019.
The company intends to build a decentralized music ecosystem that will be developed as an dapp on the Ontology blockchain. Muzika already has a very strong active user base in the tune of 2 million users so the exposure of the partnership here could work wonders in gaining Ontology brand awareness.
Let us continue to take a look at the ONT/USD market and highlight any potential areas of support and resistance heading forward.
Ontology Price Analysis
Ontology has seen a small 4.42% price hike over the previous 24-hour trading session as the cryptocurrency now trades at a value of $0.5519, at the time of writing. The market has undergone a 21% price fall over the past 7 trading days, with that bearish decline extending to over 65% over the past 30 trading days.
The Ontology project is now ranked in 32nd position and currently holds a total market cap value of $158 million.
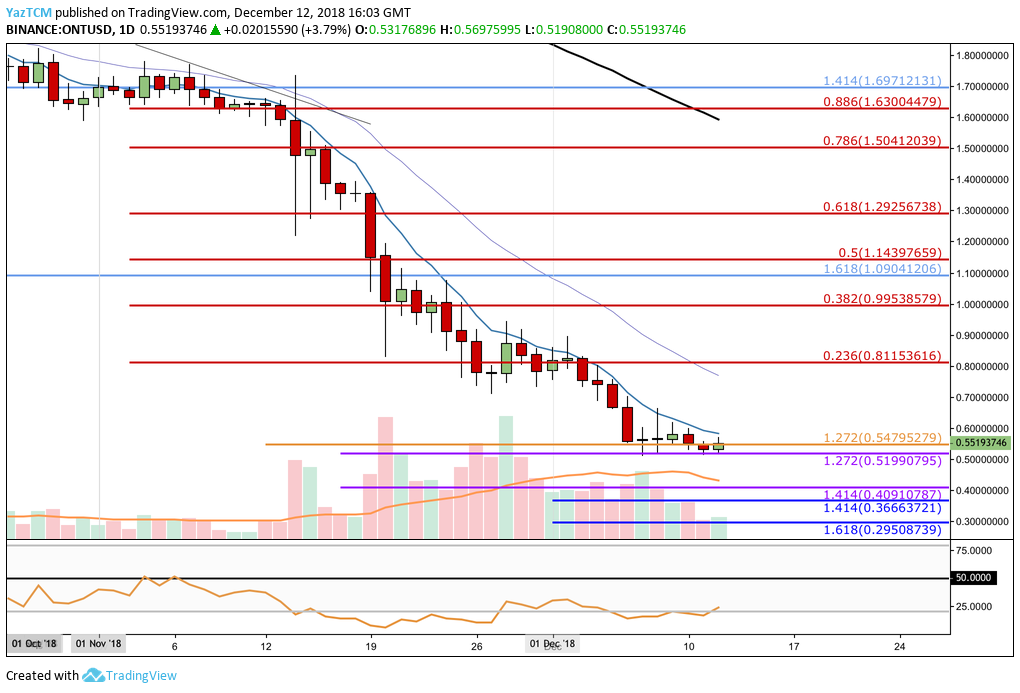
Analyzing the ONT market from the short-term perspective above, we can see that, since our last Ontology price analysis, the market has continued to decline. Support was found just beneath our previously highlighted support level at the downside 1.272 Fibonacci Extension level (drawn in orange) priced at $0.5479.
More specifically, the market had found precise support at another medium-term downside 1.272 Fibonacci Extension level (drawn in purple) priced at $0.5199.
As ONT/USD had reached this area, the market decline came to a halt as price action proceeded to trade sideways from this support level.
Trend: Bearish if ONT/USD Breaks Below $0.50
The strong combined support between $0.54 – $0.50 has provided a key area for the bulls to defend to prevent the market from slipping lower.
If price action does break below the psychological support at $0.50, we can expect the previous bearish trend to continue.
Where is the Support for ONT/USD Located Beneath the $0.50 Handle?
If the sellers do cause ONT/USD to penetrate beneath the $0.50 handle, we can expect the market to find further support below at the medium-term downside 1.414 Fibonacci Extension level (drawn in purple) priced at $0.4091.
If the bearish momentum continues to cause ONT/USD to head even lower, then more support below can be located at the short-term downside 1.414 and 1.618 Fibonacci Extension levels (drawn in blue), priced at $0.3666 and $0.2950 respectively.
What If the Buyers Start to Push ONT/USD Higher?
In our bullish scenario, if the buyers can regroup their effort and start to push the market higher, initial resistance above can be located at the psychological round number handles at $0.60, followed by $0.70.
If the bulls continue above $0.70, then higher resistance above this level can be expected at the bearish .236 and .382 Fibonacci Retracement levels (drawn in red), priced at $0.8115 and $0.9953 respectively.
What Are the Technical Indicators Showing?
The RSI has recently pointed toward the upside as it breaks up above oversold conditions.
If the RSI can continue to rise, this will indicate that the sellers are beginning to run out of momentum within the market which will give the buyers a chance to push price action higher.
Conclusion
The partnerships that Ontology has managed to amass during its short lifespan are impressive. If the project can continue to develop along the course of its roadmap and continue to draw in high-profile partnerships, then 2019 should be a fruitful year for Ontology holders.
The ONT market is resting at strong support near the $0.50 region. So long as the bulls can defend this area, we can make the assumption that ONT/USD has indeed found its bottom.