
- NEO has recently allowed their NeoVM to be deployed outside of the NEO network.
- The market is struggling to overcome resistance at $8.43.
- Support moving forward: $7.91, $7.46, $7.00, $6.50, $6.29, $5.96, $5.51.
- Resistance moving forward: $8.43, $9.00, $9.50, $10.00, $10.22, $10.44, $10.99.
Latest NEO News
NEO has already made significant development progress in the new year as they have recently made their Virtual Machine deployable outside of the NEO network. This provides more opportunities for developers to deploy smart contracts using the NeoVM in a developer-friendly environment.
They have also released their NGD Annual Report which covers topics such as community development, dapp development, global events and technical progress. Read more about these two news stories here.
Adding further to the excitement, the NEO network has seen a 3,000% increase in dapps in their ecosystem. There are now nearly 100 dapps using the NEO network as the developer-friendly network continues to grow.
The founder of NEO added to the excitement with his latest tweet advertising the NEO DevCon which is slated to take place for next month.
In his tweet, Da Hongfei mentioned that he will be focused on modules that can be added to the NEO network such as distributed storage, identity services, and layer 2 improvements that make the NEO network much more developer-friendly.
Happy NEO Year! In 2019 we will work harder to improve infrastructure. Personally I’ll focus on modules that can be added to NEO incl. distributed storage, identity, layer2, to improve NEO’s crypto-economics, and to deliver the best developer experience. https://t.co/RCT5yjMaye pic.twitter.com/bPPYbxuzSB
— Da Hongfei (@dahongfei) January 2, 2019
Let us continue to take a look at the NEO/USD market over the recent period and continue to highlight any potential areas of support and resistance moving forward.
NEO Price Analysis
NEO has seen a small price decline totaling 0.41% over the last 24 hours of trading, bringing the current trading price down to around $7.97. The cryptocurrency has had a relatively stable month where price action has increased by a small 3.55%.
NEO is now ranked in 18th position with a total market cap value of $511 million. The Ethereum competitor has seen a decline totaling over 55% over the past 90 trading days.
The 28-month old project now trades at a value that is 95% lower than the all-time high price.
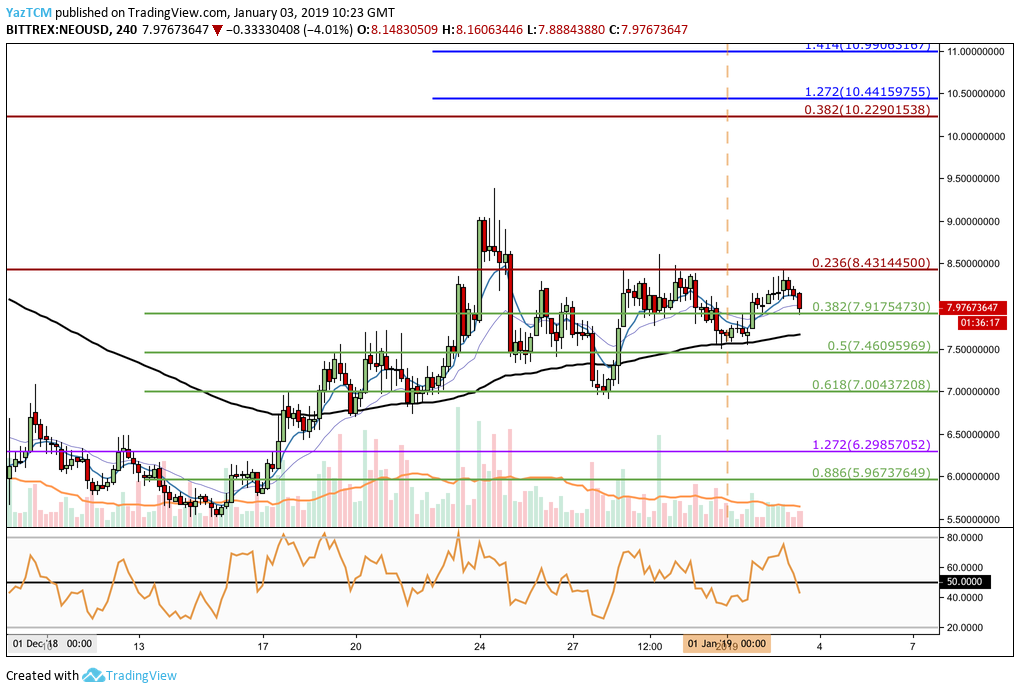
Taking a look at the market from the 4-hour chart above, we can see that NEO has reversed from its 2018 low placed on December 15, priced at $5.51. After reversing, the market went on to rally, reaching a height above $9.00 before meeting resistance.
As the market hit the $99.00 handle, the bullish trend faded and price action rolled over and began to retrace.
We can see that NEO/USD retraced up until it found further support below at the short-term .618 Fibonacci Retracement level (drawn in green) priced at $7.00 before bouncing higher once again.
After the bounce, the market went on to rise until it met resistance at the bearish .236 Fibonacci Retracement level (drawn in red) pried at $8.43.
Price action has yet to break above this level of resistance as the market is now currently trading at support provided by the short-term .382 Fibonacci Retracement level (drawn in green) priced at $7.91.
Trend: Bullish Above $9.50
The previous long-term bear trend seems to have ceased at this moment in time. For the bear trend to be reactivated, we would need to see price action for NEO/USD drop below the $5.51 handle once again.
Currently, NEO/USD is trading in a period of consolidation as it aims to break above the resistance at $8.43. For the market to be considered bullish, we would need to see price action break up above the $9.50 handle and continue higher.
Where is the Resistance for NEO Located Above $8.43?
If the buyers can begin to cause NEO/USD to climb up above $8.43, we can expect resistance above to be located at the $9.00 and $9.50 handles.
If the buyers can continue to break above the $10.00 level, then more resistance above can be expected at the bearish .382 Fibonacci Retracement level (drawn in red) priced at $10.22. This bearish Fibonacci Retracement is measured from the high seen during November 2018 to the low in December 2018.
If the bulls continue to drive price action higher above $10.22, we can expect more resistance toward the upside to be located at the short-term 1.272 and 1.414 Fibonacci Extension levels (drawn in blue), priced at $10.44 and $10.99 respectively.
Where is the Support Located Below $7.91?
If the bearish pressure continues within the market and NEO/USD falls below the support at $7.91, we can expect immediate further support below to be located at the .5 and .618 Fibonacci Retracement levels (drawn in green), priced at $7.46 and $7.00 respectively.
If the selling pressure causes price action to drop even further, more support below can be located at the downside 1.272 FIbonacci Extension level (drawn in purple) priced at $6.29. This is followed by the short-term .886 Fibonacci Retracement level (drawn in green) priced at $5.96.
The final level of support to highlight is the December 2018 low priced at $5.51.
What are the Technical Indicators Showing?
On the daily chart, the RSI remains above the 50 handle which indicates that the bulls are still in possession of the market momentum. If the RSI can remain above the 50 handle over the next few days, we can expect NEO/USD to continue to climb further.
Conclusion
NEO has already started the year well with this latest development regarding the deployment of the NeoVM outside of the NEO network.
With the NEO DevCon approaching, we could see the number of dapps slowly increase as the NEO network continues to rival the Ethereum network for dapp adoption.