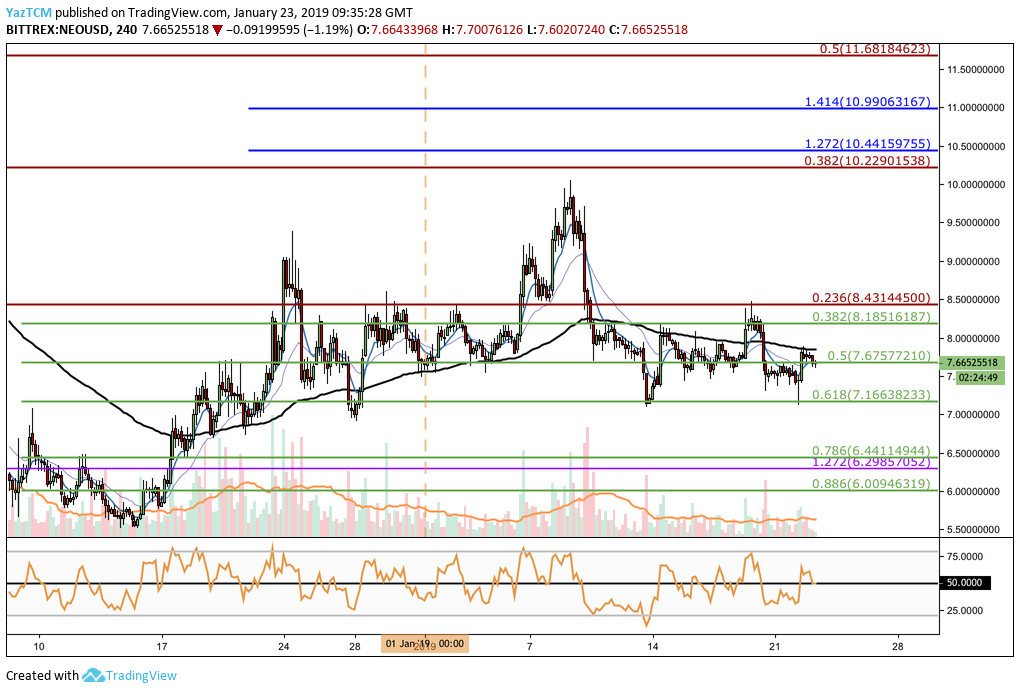
- Support for NEO moving forward: $7.67, $7.16, $7.00, $6.44, $6.29, $6.00, $5.50.
- Resistance for NEO moving forward: $8.18, $8.43, $10, $10.22, $10.44, $10.99, $11.68.
NEO Price Analysis
NEO has seen a small price increase totaling 1.97% over the past 24 hours of trading, bringing the current trade price up to around $7.66, at the time of writing. It has seen a 1.19% price decline over the past 7 trading days, with a further price fall of 10% over the past 30 trading days.
Now ranked at 17th position, NEO currently holds a total market cap value of $497 million. The 28-month old project is has lost a steep 53% price over the past 90 trading days as it now trades at a value that is 95% lower than the all-time high price.
NEO/USD Price
After our previous NEO analysis, NEO/USD continued to ascend to reach a high around $10 before rolling over. After reversing, price action went on to fall to the short-term .618 Fibonacci Retracement level (drawn in green) priced at $7.16.
After reaching this level of support, price action rebounded but only managed to reach resistance slightly higher at the short-term .382 Fibonacci Retracement level (drawn in green) priced at $8.18.
Since then, price action has established a narrow trading range between $8.18 and $7.16.
Trend: Neutral
As price action is trading within the narrow trading range outlined above, the current trading condition is neutral.
For a bullish market, we would need to see NEO/USD break above $8.15. If price action breaks below the $7.16 handle, then it would be considered a bearish market.
Where is the Support Below the Current Market Price?
If price action falls below the $7.67 handle, there is further support immediately below at the lower boundary of the trading range provided by the short-term .618 Fibonacci Retracement level (drawn in green) priced at $7.16.
If the sellers push NEO/USD below the lower boundary of the trading range, we can then expect further support beneath at the short-term .786 and .886 Fibonacci Retracement level (drawn in green), priced at $6.44 and $6.00 respectively.
The final level of support below to highlight is located at the December 2018 trading low, where the market had previously reversed, around the $5.50 handle.
Where Will the Market Meet Resistance Towards the Upside?
If price action begins to climb again, immediate resistance above can be found at the short-term .382 Fibonacci Retracement level (drawn in green) priced at $8.15, closely followed with more resistance slightly higher at the bearish .236 Fibonacci Retracement level (drawn in red) priced at $8.43.
This bearish Fibonacci Retracement is measured from the high seen during November 2018 to the low seen in December 2018.
Further resistance above this will then be expected at the January 2019 high around the $10 handle, with more resistance at the bearish .382 Fibonacci Retracement level (drawn in red) priced at $10.22.
If the buyers continue to push NEO/USD higher, more resistance above is located at the short-term 1.272 and 1.414 Fibonacci Extension level (drawn in blue), priced at $$10.44 and $10.99 respectively.
NEO/BTC Price
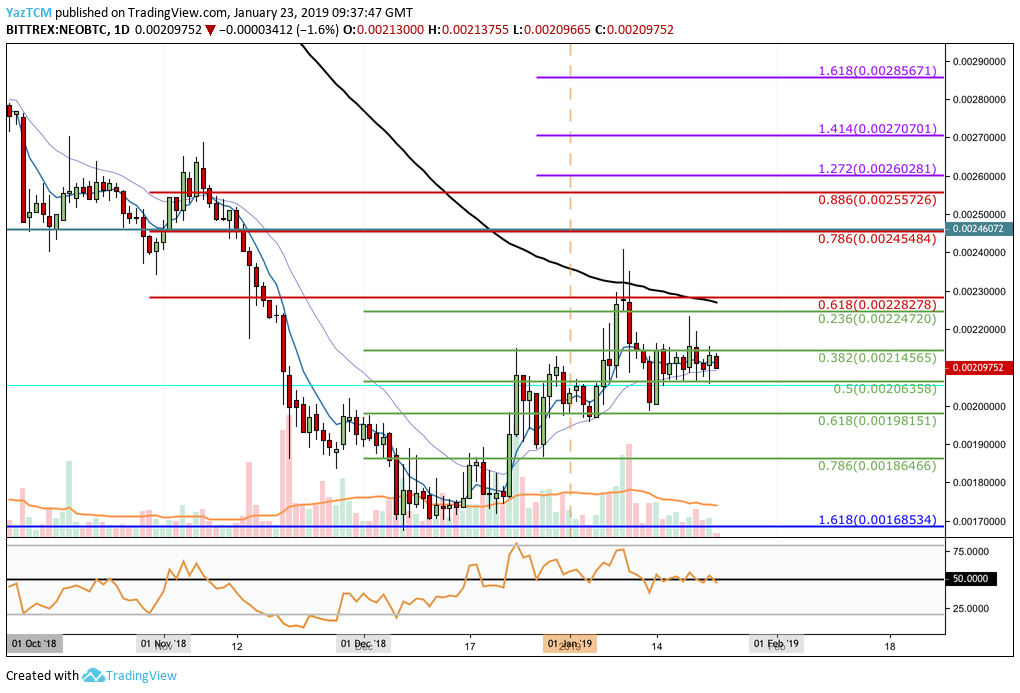
Taking a look at NEO/BTC from the medium-term perspective above, we can see that the market had fallen significantly from its high above 0.0026 SATS in November 2018 to the low of 0.0016 during December 2018. The market decline reversed as it met support at the downside 1.618 Fibonacci Extension level (drawn in blue) priced at 0.001685 SATS.
Since rebounding at the support at 0.001685 SATS, NEO/BTC has gone on to rapidly increase, reaching a high around 0.0024 SATS during early January 2019. The market met resistance at a bearish .618 Fibonacci Retracement level (drawn in red) priced at 0.002282 SATS. This bearish Fibonacci Retracement is measured from the high seen in November 2018 to the low in December 2018.
After reversing from the high, the market rolled over and began to fall until it found support at the short-term .618 Fibonacci Retracement level (drawn in green) priced at 0.001981 SATS.
NEO/BTC is now trading just below resistance at the short-term .382 Fibonacci Retracement level (drawn in green) priced at 0.002145 SATS.
Trend: Neutral
The market is still trading within the retracement of its swing leg higher and therefore the current trend is neutral.
For this market to resume a bullish trend, a price action break above 0.0023 SATS is needed. For this market to be considered bearish, we would need to see price action break below the 0.002 handle once again.
Where is the Support Located Below the Current Market Price?
If the sellers continue to pressure price action lower, immediate support can be found at the short-term .5 and .618 Fibonacci Retracement level (drawn in green), priced at 0.002063 SATS and 0.001981 SATS respectively.
Further support below can then be expected at the short -erm .786 FIbonacci Retracement level (drawn in green) priced at 0.001864 SATS. This is followed by more support at the previous long-term downside 1.618 Fibonacci Extension level (drawn in blue) priced at 0.001685 SATS.
Where is the Resistance Located Above the Current Market Price?
If NEO/BTC rises, we can expect higher resistance at the short-term .382 Fibonacci Retracement level (drawn in green) priced at 0.002145 SATS.
Further resistance towards the upside will then be expected at the bearish .618 and .786 Fibonacci Retracement levels (drawn in red), priced at 0.002282 SATS and 0.002454 SATS respectively.
If the buying pressure can continue to break above the bearish .886 Fibonacci Retracement level (drawn in red) priced at 0.002557 SATS, higher resistance will be located at the short-term 1.272 and 1.414 FIbonacci Extension level (drawn in purple), priced at 0.002602 SATS and 0.002707 SATS respectively.


