
- Nano has released version 17 of their network called Boulton.
- The market has recently surged back above the $1.00 handle.
- Support moving forward: $1.00, $0.9535, $0.90, $0.8624, $0.7784, $7414.
- Resistance moving forward: $1.04, $1.22, $1.37, $1.45, $1.52, $1.73, $1.86, $2.00
Latest Nano News
On December 18, 2018, Nano launched their latest network upgrade, known as Boulton.
Boulton, which is the 17th upgrade to the network, has been described by the team as “the largest release yet” and brings their network efficiency to whole new level.
Version 17 of the Nano network brings a new feature known as “Lazy Bootstrapping.” This feature is designed to allow nodes to download the Nano blockchain ledger in a more efficient way so nodes can participate in the network quicker.
This will also mean that users will not need to wait when downloading the blockchain after long periods of inactivity, and can begin sending and receiving coins much more quickly.
For a more in-depth overview of Lazy Bootstrapping, take look at the team’s blog post written specifically on the subject.
The latest version release also comes with an upgrade to the RPC stability so users that do use RPC can be more confident with RPC commands without worry of failure.
Another added bonus is reduced resource usage, including CPU and bandwidth, as the network can handle the traffic much better.
To celebrate the release of Boulton, the team has started another treasure hunt.
#Boulton is up and running on the $NANO network! To celebrate, we’ve launched a #treasurehunt, which you should help solve!
Here’s an extra clue to help you along. Good luck! pic.twitter.com/GQAio3bqpj
— Nano (@nano) December 19, 2018
If you fancy yourself as a good detective, give the hunt a go!
Let’s now take a look at the NANO/USD market over the short term and highlight any potential areas of support and resistance moving forward.
NANO Price Analysis
Nano has seen a momentous 20% price surge over the past 24 hours of trading as price action now breaks back above $1.00 to where it is currently trading at $1.03, at the time of writing.
The cryptocurrency has now seen a 22% gain over the past 7 trading days, bringing the total 30-day deficit down to a loss around 13%.
Nano is ranked in 36th position in the market cap rankings and currently retains a $136 million market cap value. After seeing a price collapse of 57% over the past 90 trading days, the 21-month old project is now trading at a value that is 97% lower than the all-time high value.
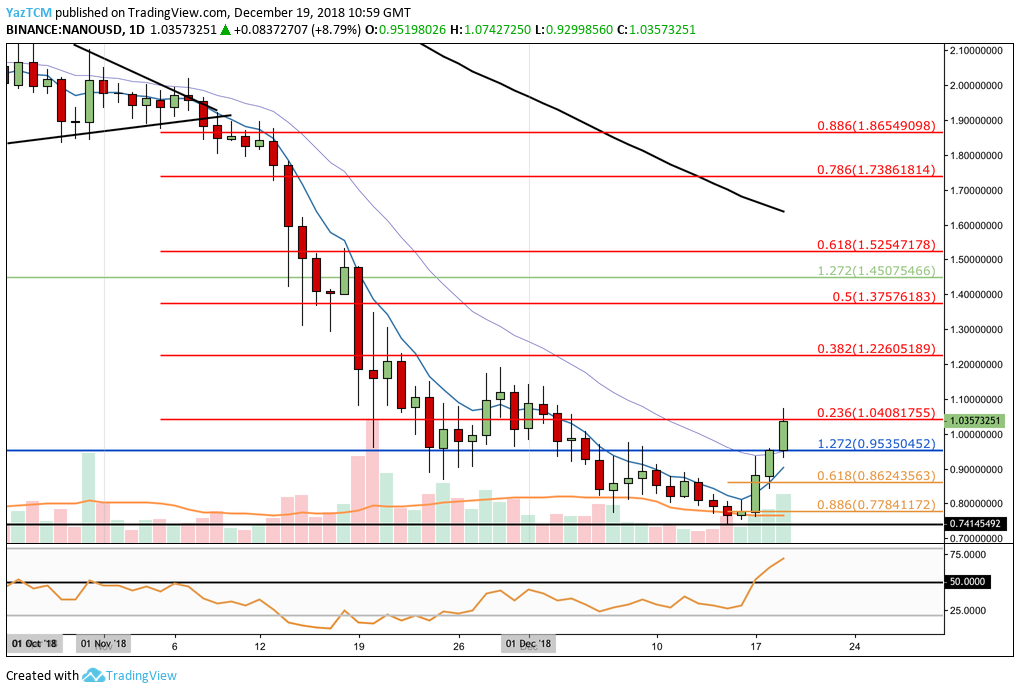
Taking a look at the short-term perspective above, we can clearly see the November 2018 price collapse. The bearish trend had came to a halt when price action found support at the August 2018 price low at $0.7414 and began to rebound.
NANO/USD has now surged above the initial level of resistance at the previous downside 1.272 Fibonacci Extension level (drawn in blue) priced at $0.95 and reached resistance at the bearish .236 Fibonacci Retracement level (drawn in red) priced at $1.04.
This Fibonacci Retracement is measured from the entire bearish market collapse from the high in November to the low recently seen in December.
Trend: Bullish Above $1.20
Although the market may have surged recently, the NANO/USD market needs to break above the previous high at $1.20 before we can
consider the market bullish. Price action is now trading in a neutral condition until $1.20 is broken.
For the market to turn bearish once again, we would need to see NANO/USD break below the previous low at $0.74.
Where is the Resistance for NANO Above $1.04?
If the buyers can continue to pressure price action higher, we can expect immediate resistance above to be located at the $1.10 handle, followed by more resistance at the bearish .382 Fibonacci Retracement level (drawn in red) priced at $1.22.
Further resistance toward the upside can then be expected at the bearish .5 and .618 Fibonacci Retracement levels (drawn in red), priced at $1.37 and $1.52 respectively.
If the bulls can continue to climb even further, then more resistance above is located at the .786 and .886 bearish Fibonacci Retracement levels (drawn in red), priced at $1.73 and $1.85 respectively.
What If the Sellers Re-Enter the Market?
If the bears regroup and begin to push price action lower, we can expect immediate significant support below to be located at the psychological round number handle at $1.00. This is closely followed by support provided by the previous medium-term downside 1.272 Fibonacci Extension level (drawn in blue) priced at $0.95.
If the sellers continue to pressure NANO/USD even lower, more support below can be expected at the short-term .618 and .886 Fibonacci Retracement levels (drawn in orange) priced at $0.8624 and $0.77, closely followed by the August 2018 price low at $0.7414.
What Are the Technical Indicators Showing?
The RSI has broken well above the 50 handle to indicate that the bulls are now in control of the market momentum. So long as the RSI remains above 50, we can expect the bullish increase to continue.
Price action for NANO/USD has also broken above both the 7-day and 21-day EMAs.
If the 7-day EMA (blue moving average) can now cross above the 21-day EMA (purple moving average), this would signal a bullish crossover and indicate that the bullish trend is increasing in pace.
Conclusion
Development is the strongest form of progress during a cryptocurrency bear market and the Nano team certainly does not lack in this category.
If the market can continue to progress higher above the $1.20 handle, we could be seeing NANO/USD back at $2.00 in no time at all.