- Support for LTC moving forward: $30.26, $27.01, $25.07, $24.74, $21.52.
- Resistance for LTC moving forward: $32.54, $34.82, $39.75, $41.37, $43.80, $46.49, $49.56.
Latest Litecoin News
This week has seen an announcement that Coingate, a cryptocurrency merchant payment provider with over 4500 merchants, has implemented the Lightning Network for Litecoin payments.
The implementation is on a trial basis, for now, with more merchants expected to add the service due to the cost savings that the Lightning Network can provide.
Let us continue to analyse price action for Litecoin over the recent period and highlight any potential areas of support and resistance moving forward.
LTC Price Analysis
Litecoin has seen a small price increase totaling 1.68% over the past 7 trading days but is down by almost 10% over the previous 30 trading days. Litecoin, at the time of writing, is currently trading at a price around the $31.90 handle.
Litecoin has seen a sharp 39% price drop over the past 90 trading days, and now the 69-month old project trades at a value that is 91% lower than the all-time high price.
Ranked in 8th, Litecoin currently holds a $1.91 billion market cap valuation. It sits a small $40 million behind 7th place competitor, Stellar.
LTC/USD Price
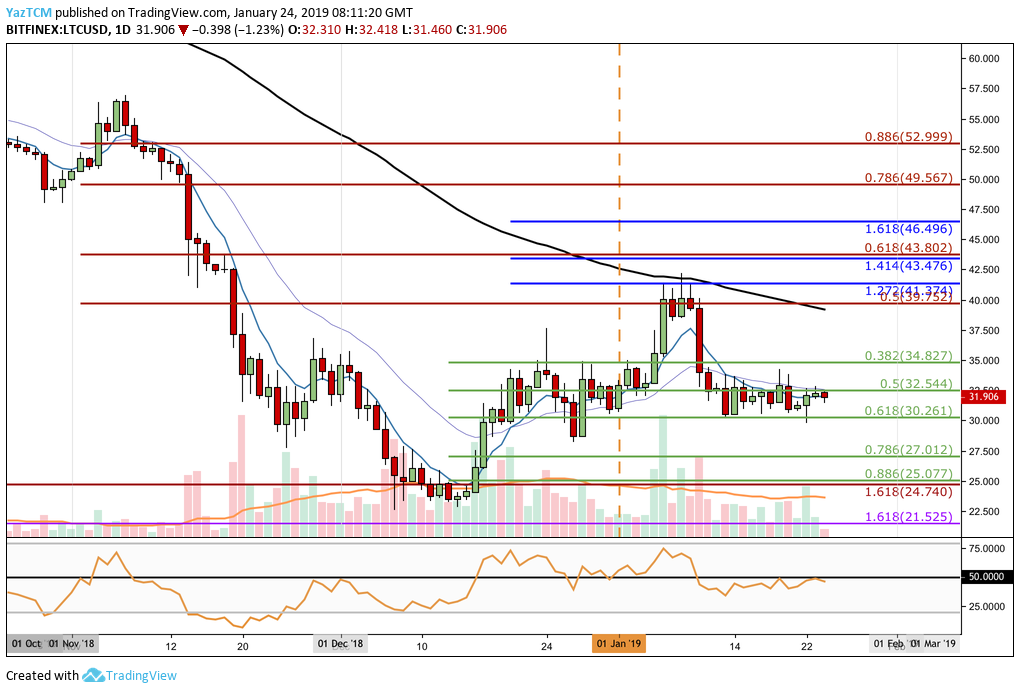 Analyzing price action for LTC/USD from the daily chart above, we can see that price action has still yet to break above the resistance level at the .5 Fibonacci Retracement level (drawn in green) priced at $32.54, highlighted in our previous LTC analysis.
The market started 2019 extremely well as price surged from a low around $24 to a high of $43.50. The market met resistance in the first week of January 2019 at a short-term 1.272 Fibonacci Extension level (drawn in blue) priced at $41.27 before price began to roll over and decline.
The market then fell into support at the .618 Fibonacci Retracement level (drawn in green) priced at $30.26, which had halted the decline.
Trend: Neutral
The market is currently trading sideways between the support at the short-term .618 Fibonacci Retracement level (drawn in green) priced at $30.26 and the $34.00 handle.
For this market to be considered bearish, we would need to see price action break below the $30.00 handle. For the market to be considered bullish, we would need to see price action break above the $35 handle.
Where is the Support Below the Market?
If the sellers begin to drive price action for LTC/USD lower once again, we can expect immediate support towards the downside at the short-term .618 Fibonacci Retracement level (drawn in green) priced at $30.26.
If LTC/USD falls below the $30 handle, further support can be located at the short-term .786 and .886 Fibonacci Retracement level (drawn in green), priced at $27.01 and $25.07 respectively.
More support below this can then be expected at the long-term downside 1.618 FIbonacci Extension level (drawn in purple) priced at $21.52.
Where is the Resistance Above the $32.54 Handle?
If the bulls can cause LTC/USD to break above the current resistance at the short-term .5 Fibonacci Retracement level (drawn in green) priced at $32.54, we can expect further higher resistance above at the short-term .382 Fibonacci Retracement level (drawn in green) priced at $34.82.
More resistance towards the upside will then be located at the bearish .5 Fibonacci Retracement level (drawn in red) priced at $39.75, closely followed by resistance at the short-term 1.272 and 1.414 FIbonacci Extension levels (drawn in blue) priced at $41.37 and $43.47.
The resistance at the $43.47 handle is also further bolstered by the bearish .618 Fibonacci Retracement level (drawn in red) priced at $43.80, adding further to the expected resistance in this area.
LTC/BTC Price
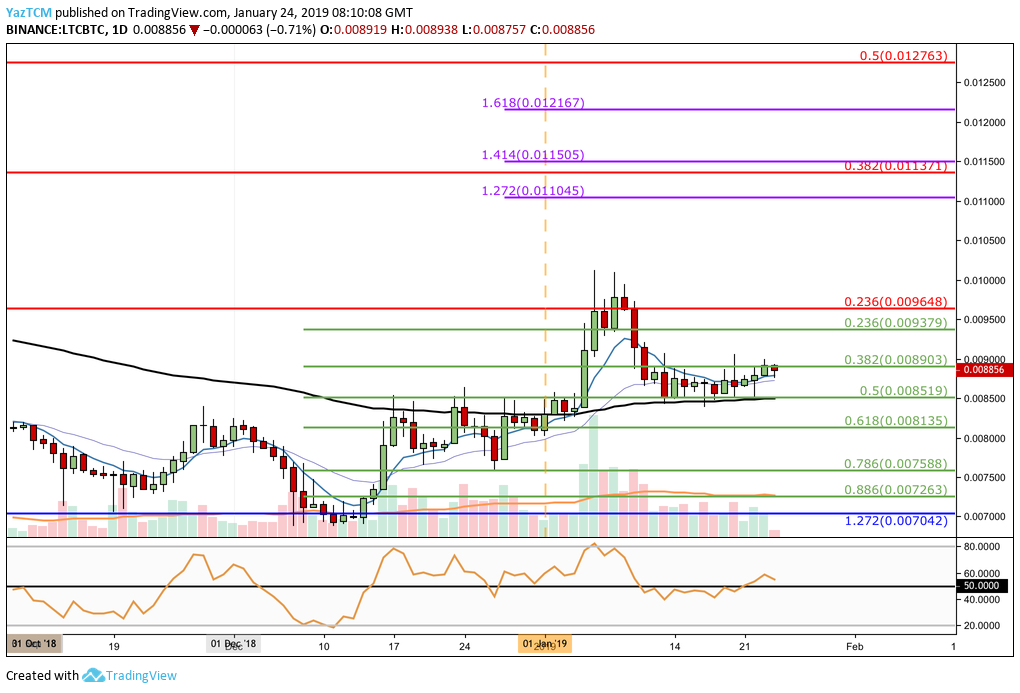
Taking a look at the daily chart above for LTC/BTC, we can see that the market had reversed during mid-December at a downside 1.272 Fibonacci Extension level around the 0.007042 SATS handle. Since rebounding, the market then went on to rally to a high at the 0.01 handle.
The market ran into resistance at the bearish .236 Fibonacci Retracement level (drawn in red) priced at 0.009648 and then proceeded to decline. Price action then fell into support at the short-term .5 Fibonacci Retracement level (drawn in green) priced at 0.008519 SATS.
It is important to mention that this area of support also contains the 100-day moving average, adding further to the expected support in the area.
The LTC/BTC market has bounced from the support at 0.008519 SATS, and is now trading at resistance provided by the short-term .382 Fibonacci Retracement level (drawn in green) priced at 0.008903 SATS.
Trend: Neutral
As the market is trading within a retracement from the previous swing higher, it is currently in a neutral condition.
If price action breaks below the 0.008519 SATS support level, the market will then be considered as bearish. If it breaks above 0.01 SATS, we can then consider the market to be bullish.
Where Will the Market Meet Higher Resistance Above 0.008903 SATS?
If the buyers push price action above the current resistance at the 0.008903 SATS handle, we can expect more resistance towards the upside to be located at the bearish .236 Fibonacci Retracement level (drawn in red) priced at 0.009648 SATS.
Further resistance above the 0.01 SATS level can be located at the short-term 1.272 Fibonacci Extension level (Drawn in purple) priced at 0.01104 SATS. This is closely followed by the bearish .382 FIbonacci Retracement level (drawn in red) priced at 0.01137 SATS.
There is higher resistance above this level at the short-term 1.414 and 1.618 Fibonacci Extension levels (drawn in purple) priced at 0.01150 SATS and 0.01216 SATS, respectively.
Where is the Support Beneath the Current Market Price?
If the sellers begin to drive price action lower for LTC/BTC, we can expect immediate support below at the short-term .5 Fibonacci Retracement level (drawn in green) priced at 0.008519 SATS.
Further support below this can then be expected at the short-term .618 and .786 Fibonacci Retracement levels (drawn in green) priced at 0.008135 SATS and 0.007588 SATS, respectively.