
- Bitcoin continues to battle at support along the $3,400 handle.
- There are some signals that the bearish trend is shifting as Weiss recommends the buying opportunity at the current price.
- Support moving forward: $3,405, $3,400, $3,083, $3,000, $2,885, $2,482, $2,356.
- Resistance moving forward: $3,701, $3,906, $4,000, $4,298, $4,576, $4,931, $5,360.
Latest Bitcoin News
Bitcoin has had a very turbulent 30-day trading period as price action plummets by a total of 46%. The cryptocurrency now trades around the $3,400 handle.
The price collapse had started on November 14, 2018 when the market penetrated below the long-term support that had been established at $6,000. Since breaking through the support, the market has continued to fall at a disturbing rate which many analysts had failed to predict.
However, there have been some potential signs that the worst of the capitulation is over in the BTC markets as the Weiss Rating agency has recently started that now is the best time for people to invest in Bitcoin at the current prices. They have gone as far as saying that the current low price of Bitcoin has presented one of the best buying opportunities of the year so far.
To add further to this suggestion that the worst of the price decline has passed, the Bitcoin ETP on the SIX Swiss Stock Exchange has set a new record in the volume traded on the product. Last Friday, December 7, saw the ETP trade over 62,000 shares, far above the 20,000 monthly average.
It has been suggested that this is institutional investors that are “buying the dip” and holding now for the recovery stage of the market collapse. The ETP is an exchange traded product that represents an underlying basket of cryptocurrencies, including BTC, ETH, XRP and LTC.
However, not all analysts are on the same page — some believe that there is still more damage ahead.
Stephen Innes, head of Asia Pacific trading at the forex company Oanda, has recently stated that Bitcoin is still due another drop in price. His reasons are that Bitcoin has still failed to produce a real-world use case, besides from being a store of value, suggesting that Bitcoin needs more adoption before it can commence a recovery.
Whichever side of the market you are on it, is always important to know the significant support and resistance levels moving forward, so let us take a look at price action and some important levels to watch out for.
Bitcoin Price Analysis
Bitcoin has seen a small 1.17% price decline over the previous 24-hour trading period as the market now trades at the $3,465 handle, at the time of writing.
The cryptocurrency has seen a 10.56% price fall over the past 7 trading days with a further 46% price collapse over the previous 30 trading days.
The #1 ranked cryptocurrency presently holds a $59.56 billion market cap value as the 67-month old project now trades at a value that is 82% lower than the all-time high price.
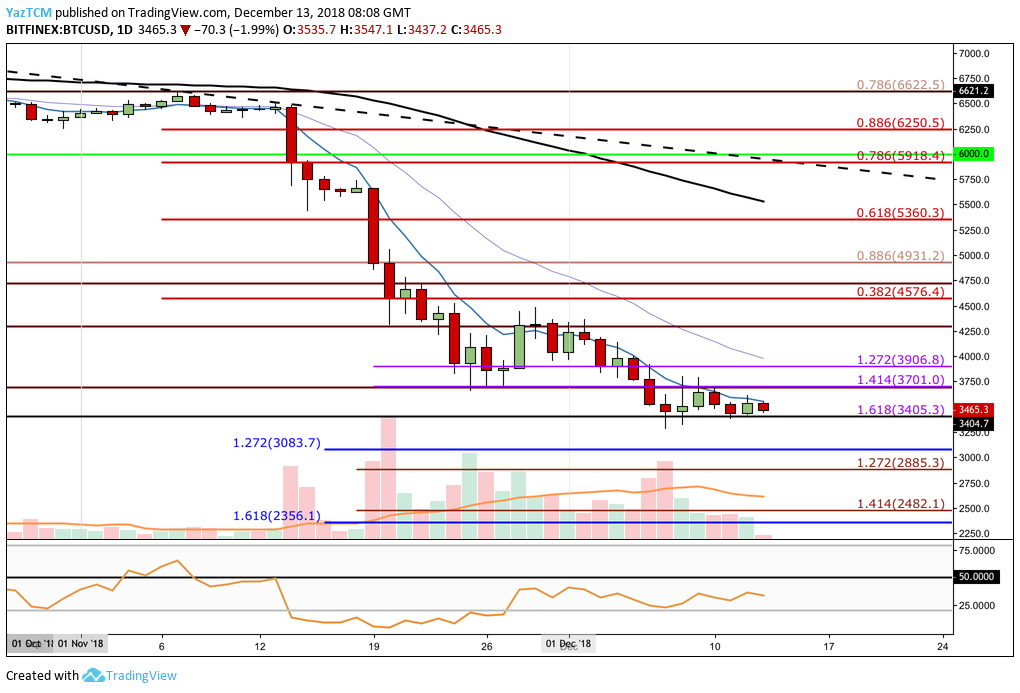
Taking a look at the BTC market from the short-term perspective above, we can clearly see the bloodbath that commenced during November 2018, which saw BTC fall from a high above $6,500 to a low around $3,700 toward the end of the month.
The market had found support at a short-term downside 1.414 Fibonacci Extension level (drawn in purple) priced at $3,701 at the end of November 2018. \However, this support level failed to hold as price action fell further in December 2018.
We can see that BTC/USD has now found a further level of support at the short-term downside 1.618 Fibonacci Extension level (drawn in purple) priced at $3,405. As price action reached this area, the market proceeded to trade sideways as the market players battle to decide which direction to head toward next.
Trend: Bearish Below $3,400
If BTC/USD continues to head lower and closes below the $3,400 support level, we can expect further declines in the days ahead.
Right now, the market is trading sideways — the sellers have run out of steam and failed to continue to push the market downward.
Where is the Support for BTC/USD Below $3,400?
If the sellers manage to successfully continue with the market decline, immediate support beneath $3,400 to be located at the medium-term downside 1.272 Fibonacci Extension level (drawn in blue) priced at $3,083.
Further support below this can then be expected at the psychological round number support at the $3,000 handle.
If the bears penetrate below $3,000, further support beneath can be expected at the short-term downside 1.272 and 1.414 Fibonacci Extension levels (drawn in red), priced at $2,885 and $2,482 respectively.
More support below is then expected at the medium-term downside 1.618 Fibonacci Extension level (drawn in blue) priced at $2,356.
What If the Bulls Can Defend $3,400?
If the buyers can prevent BTC/USD from falling further below $3,400 and start to form a recovery, we can expect immediate resistance toward the upside to be located at the previous short-term 1.414 and 1.272 Fibonacci Extension levels (drawn in purple), priced at $3,701 and $3,906 respectively.
Strong resistance above this can be expected at the round number level at $4,000.
If the bulls continue to climb higher above the $4,000 handle, then more significant resistance above can be located at the bearish .382 and .618 Fibonacci Retracement levels (drawn in red), priced at $4,576 and $5,360 respectively.
What Are the Technical Indicators Showing?
The RSI is climbing, which is a sign that the sellers are losing their grip on the market momentum.
If the RSI can continue and break above the 50 handle, we could see BTC begin making its recovery back above the $4,000 handle.
Conclusion
Inreality, nobody knows where the “bottom” of the market is and traders are quick to learn that it is suicide to try and call tops and bottoms.
Despite this, we can continue to watch and analyze the market to make informed trading decisions about when to buy and when to exit, based on price action itself.
In the case of Bitcoin, we know that if price action does fall below $3,400, then the year-long bearish trend shall continue further into expected support beneath.
However, if BTC/USD starts to rise from the support at $3,400 and continues to break above $4,000, we could suspect that the sellers have exhausted their reserves and a recovery could be on the table.