
IOTA has seen a decent price increase totaling more than 12.50% over the past 7 trading days, bringing the price for the cryptocurrency up above the $0.40 level once again. Considering that Bitcoin has fallen by a total of -1% over the same period, an increase of 12.50% is very respectable.

IOTA is now ranked in 15th position among the top cryptocurrency projects by market cap value, as it currently holds a total market cap of $1.13 billion.
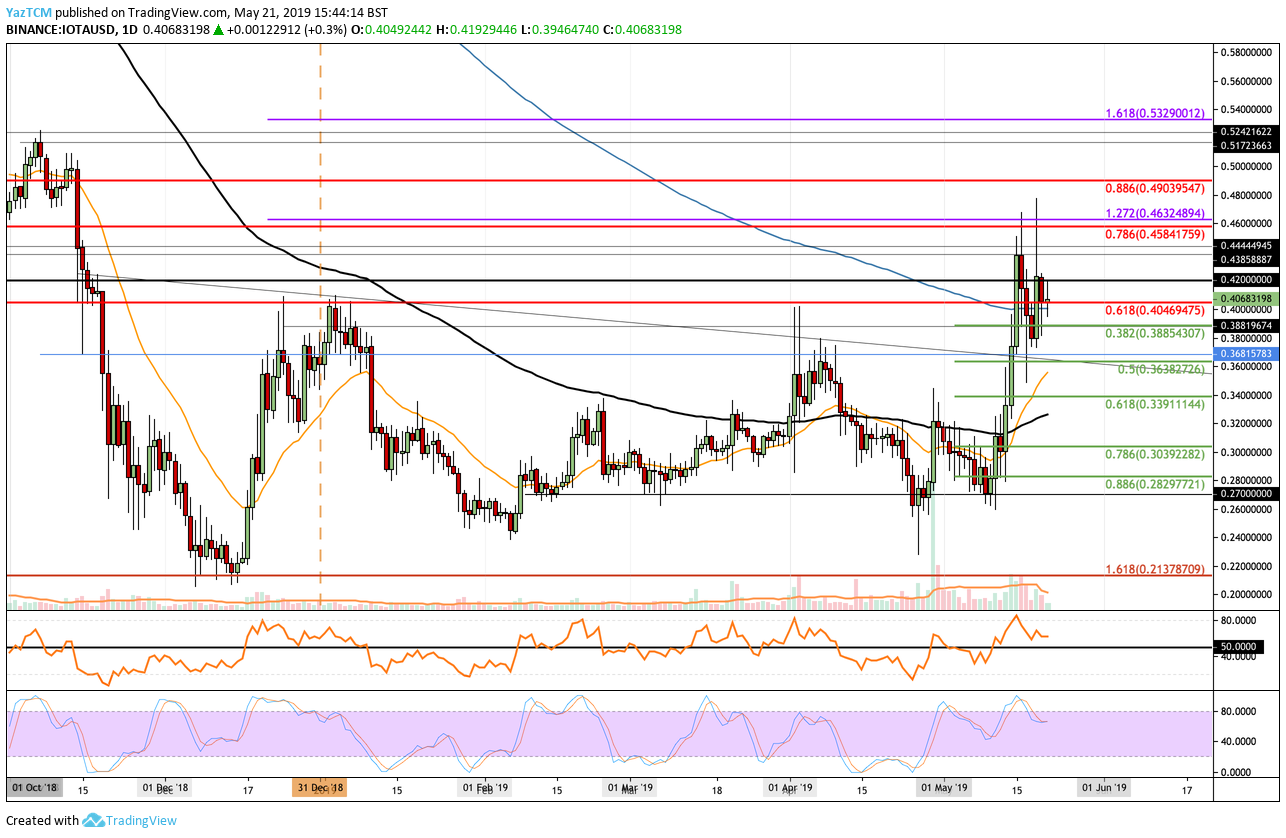
In this article, we will take a look at the IOTA/USD markets and highlight where IOTA could potentially head this week. The market is currently trading at a level of support provided by the 200-day EMA, and if it can hold above $0.40 we can expect IOTA/USD to at least hit the $0.45 level, and possibly $0.49.
Let us take a look at IOTA/USD and highlight some potential areas of support and resistance moving forward.
IOTA Price Analysis
IOTA/USD – MEDIUM TERM – DAILY CHART
What Has Been Going On?
Taking a look at the IOTA/USD daily chart above, we can see that during May 2019, IOTA managed to surge by a total of 84% from a low around $0.26 to a high around $0.48. The price surge allowed IOTA to climb above both the 100-day moving average level and the 200-day moving average level.
IOTA has since fallen from the high and is now trading at support provided by the 200 day moving average level around the $0.40 level.
What Is the Current Trend?
The recent break above the $0.40 level has now rendered this market as bullish in the short term. For this bullish trend to be invalidated, we would need to see IOTA fall and break beneath the $0.36 level.
Over the long term, as IOTA has recently managed to increase 2x from the bottom price of $0.20, we can assume that we have now officially exited the previous bearish trend.
Where Are Prices Headed?
If the bulls continue to climb further higher from the $0.40 support level, we can expect immediate higher resistance above to be located at $0.42 and $0.4385. Above this, further resistance is then expected at $0.4444 and $0.4584. The resistance at $0.04584 is provided by a long-term bearish .786 Fibonacci Retracement level (drawn in red), measured from the November 2018 high to the December 2018 low.
If the buying continues above the $0.045 level, further higher resistance can then be located at the $0.47 and $0.48 levels. Above $0.48, we can expect more resistance at the long-term bearish .886 Fibonacci Retracement level (drawn in red), priced at $0.4903. If the positive price action continues for IOTA, we can expect the coin to hit this level by the end of the week, which would constitute a 20% price increase from today’s price.
Alternatively, if the market collapses beneath the $0.40 level, we can then expect immediate support beneath to be located at the short-term .382 and .5 Fibonacci Retracement levels (drawn in green), priced at $0.3885 and $0.3638 respectively. Beneath this, further support can be located at $0.3391, $0.32, and $0.30.
What Are the Technical Indicators Showing?
The RSI has recently produced a bearish signal in overbought territory which should provide caution to the bulls within the market. However, if the RSI can remain above the 50 level and rebound higher, we can expect IOTA/USD to remain above the $0.40 level and head toward $0.45.
Conclusion
If the bullish trend continues within the market, IOTA can most certainly increase by a total of 20% by the end of the week to reach the $0.49 level. However, if IOTA/USD fails to reach $0.49, the next target beneath this is expected at $0.45.