
IOTA has been enjoying the recent price bump caused by the Bitcoin rise over the past few days as the cryptocurrency breaks above the $0.30 level to where it currently trades around $0.35. IOTA has now seen a 15% price hike over the past 7 trading days with a further 28% price surge over the past 30 trading days.
The recent price increase has now allowed IOTA to break above the 100 day moving average for the first time since June 2018, an incredibly strong bullish signal.
IOTA is ranked in 15th position as it presently holds a $978 million market cap valuation. The cryptocurrency is closing in on 14th ranked position, Monero, as it continues to close the $130 million gap in market cap value. The 22 month old cryptocurrency project now trades at a value that is 93% lower than the all time high price around $6.40.
In this article we will take a look at the potential for IOTA to rise by 45% in April 2019 and hit the $0.50 level.
Let us take a look at the IOTA/USD market and highlight some areas of resistance for the bulls before being able to reach the $0.5 level.
IOTA Price Analysis
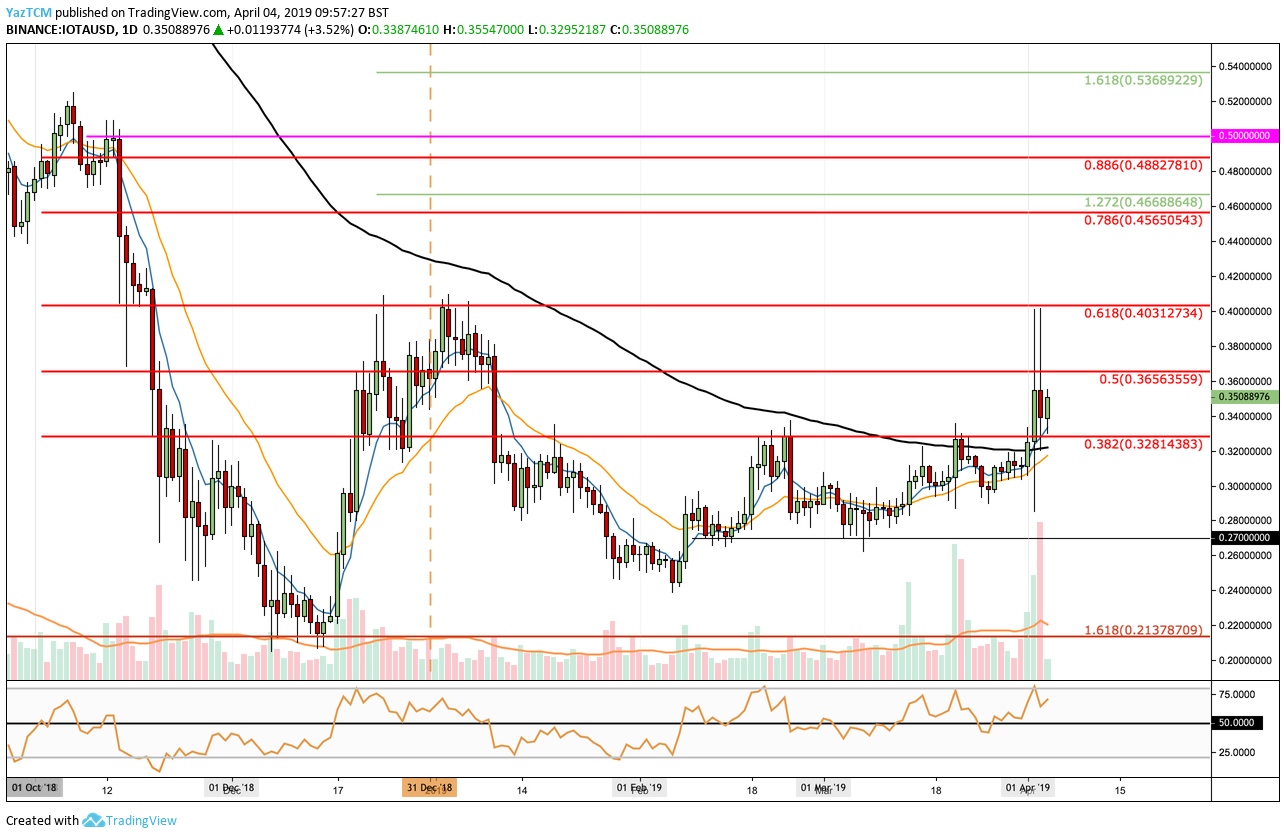
IOTA/USD – SHORT TERM – DAILY CHART
What Has Been Going On?
Analysing the IOTA/USD chart above, we can see that the market had been slowly grinding higher during February and March 2019. However, each time that price action had approached the 100 day moving average the market was turned away and was unable to break above this resistance.
The recent Bitcoin price surge has now allowed IOTA to climb above the 100 day moving average. The market continued to spike higher into resistance at the bearish .618 Fibonacci Retracement level (drawn in red) priced at $0.40. This bearish Fibonacci Retracement level is measured from the November 2018 high to the December 2018 low.
Price action has since dropped slightly but the market is now trading comfortably above the $0.35 level.
What Is The Short Term Trend For IOTA/USD?
The break above the 100 day moving average and the $0.33 level has now caused IOTA to turn bullish in the short term. For this market to be considered bearish we would need to see price action drop below the support at $0.27.
Where Is The Resistance On The Way Up To $0.5?
If the buying continues to drive IOTA/USD higher, we can expect initial resistance above to be located at the bearish .5 and .618 Fibonacci Retracement levels (drawn in red) priced at $0.3656 and $0.4031, respectively.
If the bulls can push IOTA/USD above $0.40, they will be creating a fresh 2019 high. Resistance above $0.40 can then be expected at $0.42 and then at the bearish .786 Fibonacci Retracement level (drawn in red) priced at $0.4565.
Before being able to make an attempt at the $0.50 level the market will first need to tackle resistance at the bearish .886 Fibonacci Retracement level located at $0.4882. If the buyers can clear this resistance they will be free to re-test the $0.50 level.
What Are The Technical Indicators Showing?
The RSI is sitting in comfortable bullish territory, above the 50 level, and is not too overstretched. This indicates that IOTA/USD still has room to travel further higher over the coming days. So long as the RSI can continue to climb higher, we can expect IOTA to break above the $0.40 level and create a fresh 2019 high in the coming days.
The trading volume has also been rising significantly during the start of April 2019. If the volume can remain high we can expect IOTA to continue to break above the $0.40 level and head toward $0.50.
Conclusion
IOTA has enjoyed the recent Bitcoin surge and has allowed it to create positive bullish signals after breaking above resistance at $0.33 and the 100 day moving average. If the IOTA market can clear $0.40 we can expect the bulls to drive price action higher toward the $0.50 level.