
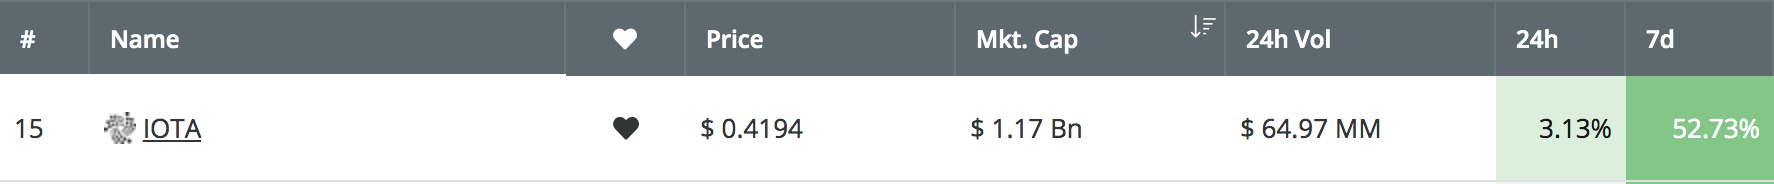
IOTA has seen an epic price explosion, resulting in a 52%+ price increase over the past 7 trading days. The recent price growth has seen IOTA’s price increase above the $0.40 level to where it is currently trading around today at around $0.41.
The recent price explosion came after IOTA has announced a partnership with Avery Dennison, a global manufacturing company with a market cap of over $9 billion. The partnership is created with the intention of creating a more sustainable and ethically sourced goods industry.
The first trial will occur with their AYLX brand, which will allow customers to track items along the supply chain for their products purchased. Customers will be able to see where the components for their product have been sourced along the entire supply chain, and they can trust that the information provided is 100% accurate due to the fact that it is recorded on the blockchain and thus immutable.
IOTA is currently ranked in 14th position, as it presently holds a $1.22 billion market cap valuation, having overtaken Tezos which has a $1.20 billion market cap.
Let us take a look at the IOTA/USD market and highlight some areas of support and resistance moving forward.
IOTA Price Analysis
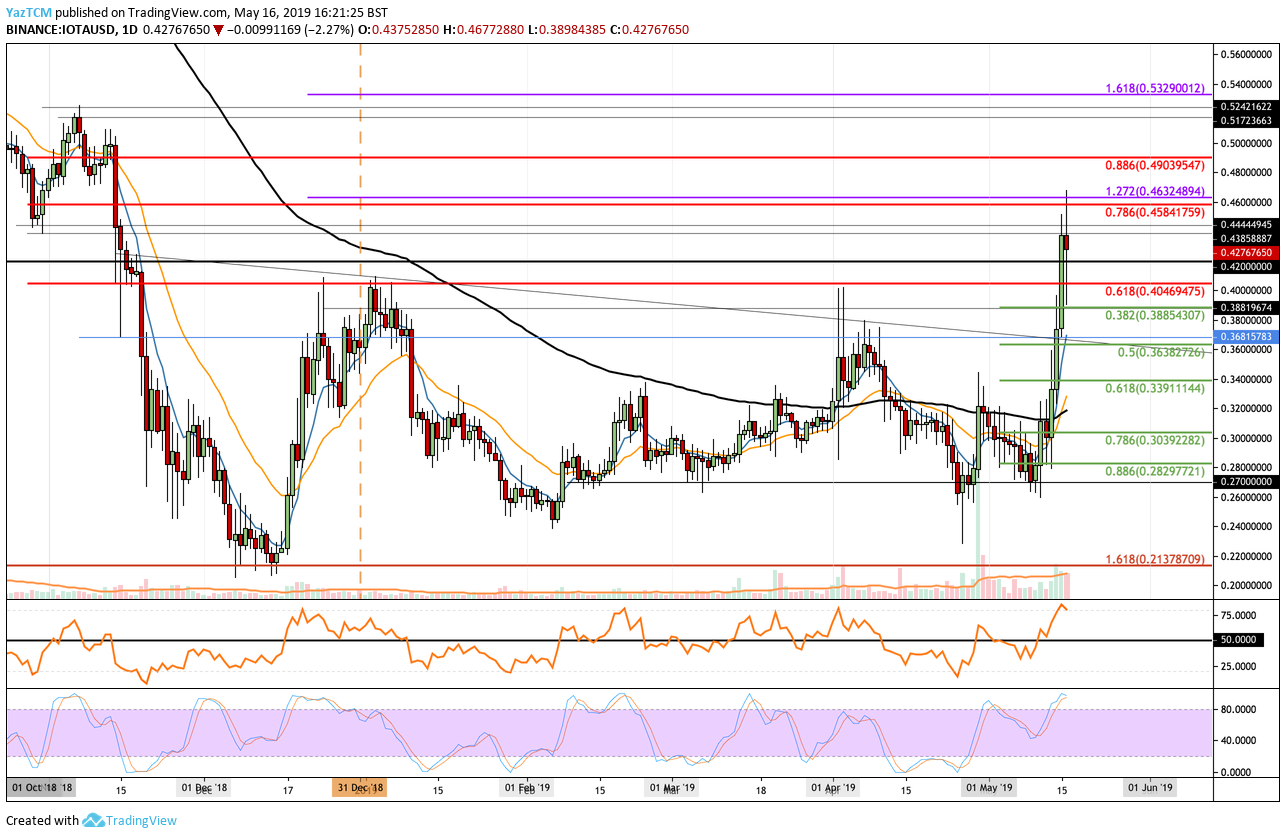
IOTA/USD – MEDIUM TERM – DAILY CHART
What Has Been Going On?
Taking a look at the IOTA/USD daily chart above, we can see that the recent price surge has allowed IOTA to climb above the 100-day moving average and continue further higher above the 2019 high at $0.40 to where it is currently trading at around $0.4276. We can see that IOTA managed to spike higher into resistance around $0.46, but was unable to maintain itself there and has since fallen.
What Is the Current Short-Term Trend?
The current short-term trend for IOTA is now bullish. For this bullish trend to be invalidated, we would need to see IOTA drop and fall beneath the $0.35 level. As IOTA has now managed to double in price from the bottom of $0.2140, we can consider that the previous bear trend has also finished in the long term.
Where Can We Go From Here?
If the bullish pressure can persist higher, we can expect immediate resistance above the market to first be located at $0.444 and then around $0.46. The resistance around $0.46 is particularly strong due to the combined resistance provided by the bearish .786 Fibonacci Retracement level (drawn in red), priced at $0.4584 and a medium-termed 1.272 FIbonacci Extension level (drawn in purple), priced at $0.4632. The bearish Fibonacci Retracement level is measured from the November 2018 high to the December 2018 low.
If the buyers can continue above $0.47, further resistance above can then be expected at the bearish .886 Fibonacci Retracement level (drawn in red), priced at $0.4903. Above this, further resistance is then located at the $0.50 level and then at the November 2018 high at $0.5242. The last level of resistance to highlight is provided by the medium-termed 1.618 Fibonacci Extension level (drawn in purple), priced at $0.5329.
What If the Sellers Regain Control?
Alternatively, if there is a small pullback and the sellers regain control, we can expect immediate support toward the downside to be located at $0.42 and $0.40. Beneath $0.40, further support lies at the short-term .382 and .5 Fibonacci Retracement levels (drawn in green), priced at $0.3885 and $0.3638, respectively.
Beneath $0.35, further support toward the downside can be found at the short-term .618 and .786 Fibonacci Retracement levels (drawn in green), priced at $0.3039 and $0.2829, respectively.
What Are the Technical Indicators Showing?
The RSI has now reached extreme overbought conditions, indicating that the buyers may be a little overstretched and could use a break soon. This sentiment is further confirmed in the Stochastic RSI, as it has also reached overbought conditions and is ready to produce a bearish crossover signal.
Conclusion
The recent cryptocurrency boom, largely helped by Bitcoin, has been well received by IOTA holders after the recent 58% price surge. However, the technical indicators are suggesting that a small retracement may be likely before we can continue higher again. We will look to the $0.40 level for the first level of support with $0.38 beneath.
After the retracement, IOTA is on track to continue its run and head further above the $0.50 level.