
Cardano, IOTA and VeChain have all exploded in price over the course of May 2019, and all three markets are now trading close to resistance to create fresh 2019 highs. If each of these coins can break their respective resistance levels, the next targets look to be even more exciting.
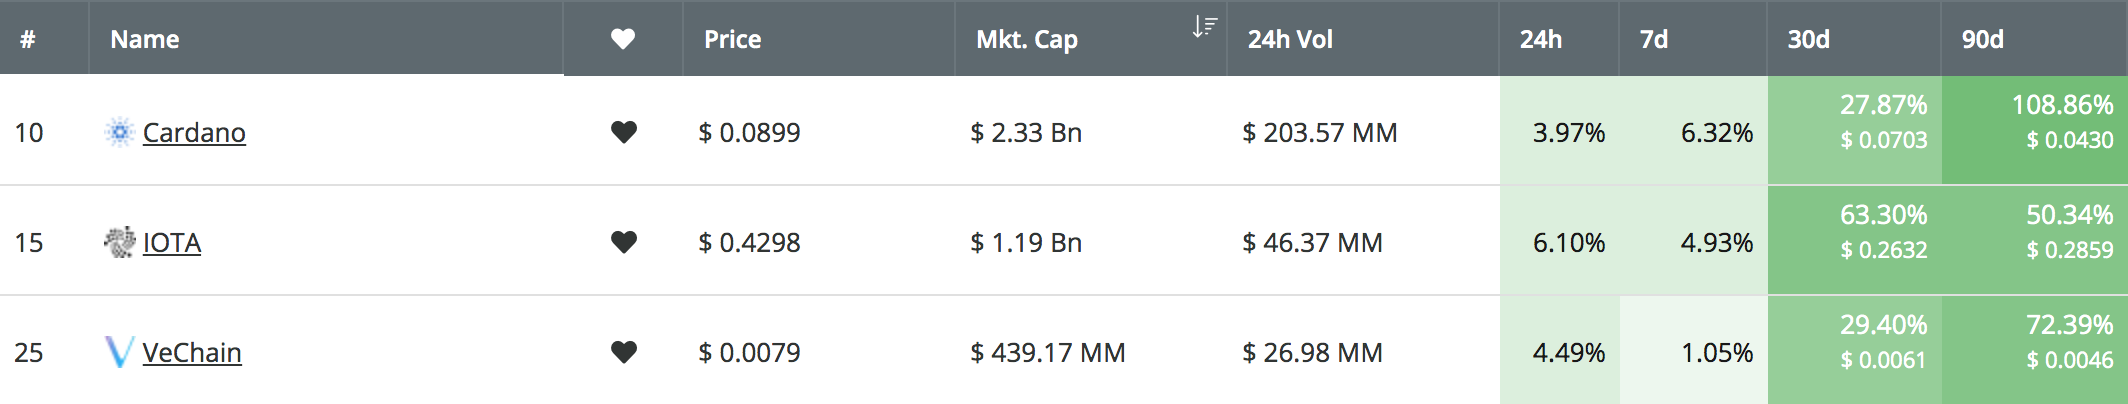
Source: CoinCheckup
IOTA is the strongest performer throughout the past 30 trading days, with a 63% price increase. This is followed up with VeChain (+29%) and Cardano (+28%). However, extending the range to the past 90 trading days, we can see that Cardano is the strongest performer of all, with a 108% price increase, with VeChain coming in second with 72% and IOTA third with 50%.
Let us continue to analyze each market and highlight some potentail areas of support and resistance heading forward.
Cardano Price Analysis
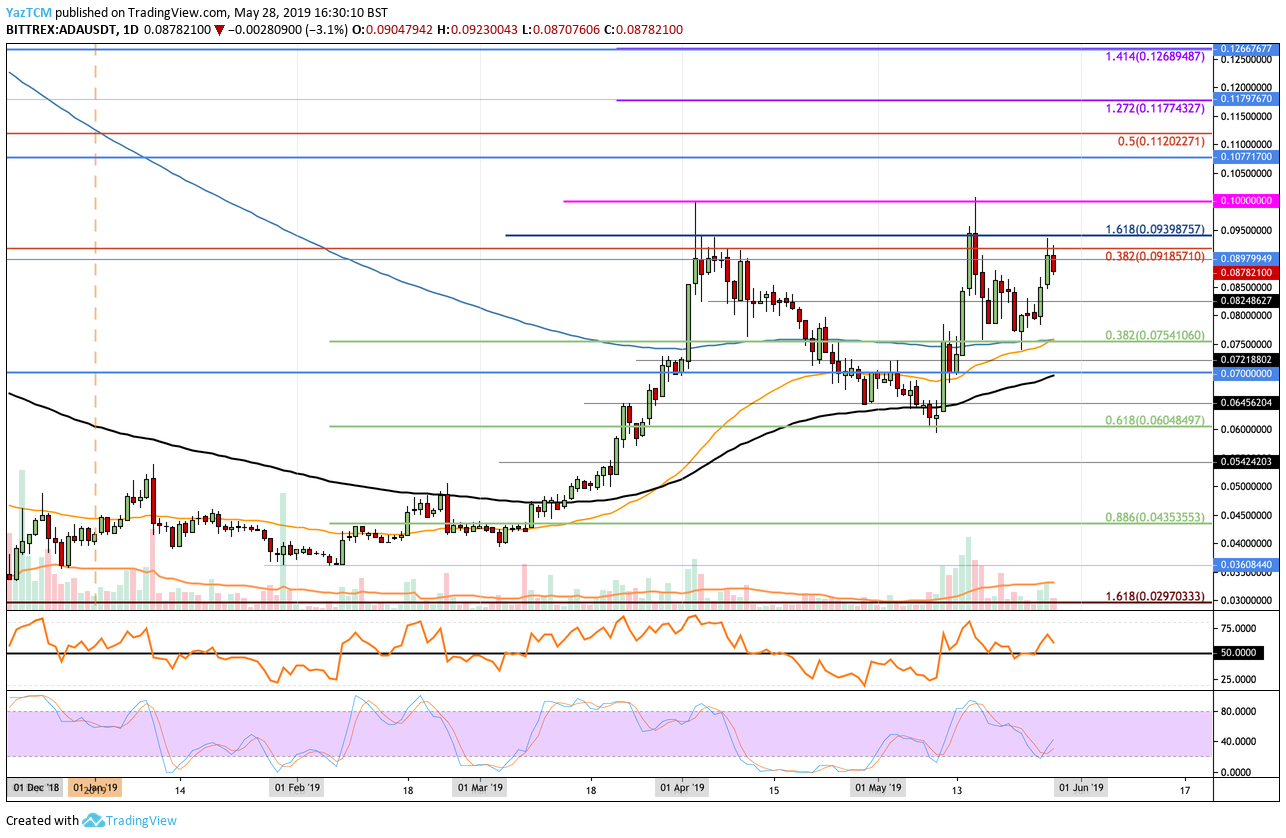
ADA/USD – MEDIUM TERM – DAILY CHART
What Has Been Going On?
Analyzing the ADA/USD chart above, we can see that Cardano has recently risen back into resistance at the bearish .382 Fibonacci Retracement level (drawn in red), priced at $0.091857. This bearish Fibonacci Retracement level is measured from the July 2018 high to the December 2018 low.
What Is the Current Trend?
The current short-term trend for Cardano remains neutral at this moment in time until ADA can break above the resistance at the $0.093 level. If Cardano was to fall and break beneath the $0.075 support level, we could consider the market as bearish in the short term.
Where Might the Market Be Headed?
The Stochastic RSI is currently trading in oversold conditions and priming itself for a bullish crossover signal. If this occurs, we can expect ADA/USD to break above the resistance at the $0.09185 level and continue higher.
Above $0.09185, further resistance is then expected at the 1.618 Fibonacci Extension level (drawn in blue), priced at $0.09398. The market was unable to close above this area of resistance during both April and May 2019, and therefore will require significant resistance to overcome.
If the buyers continue even further higher, the next level of significant resistance to highlight is located at the $0.1 level. Beyond $0.1, higher resistance is then expected at $0.107 and then at the bearish .5 Fibonacci Retracement level (drawn in red), priced at $0.1120. Reaching this target level would constitute a 27% price increase from today’s price level.
IOTA Price Analysis
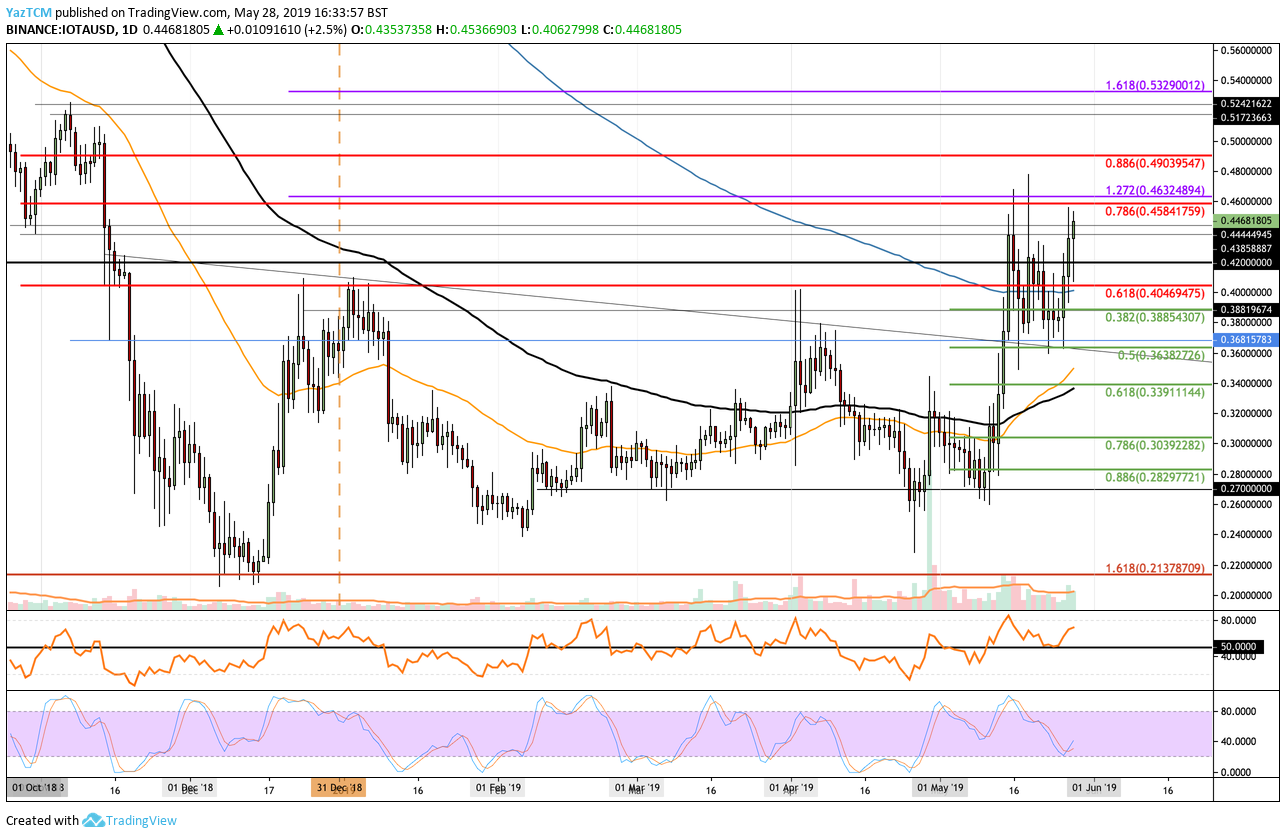
IOTA/USD – MEDIUM TERM – DAILY CHART
What Has Been Going On?
Analyzing IOTA/USD from the chart above, we can see that IOTA has now recently surged above the $0.44 level. The market rebounded from support at the short-term .5 Fibonacci Retracement level (drawn in green), priced at $0.3638 and continued higher.
What Is the Current Trend?
In the short term, IOTA is currently considered a bullish market. For the bullish trend to continue, we would need to see IOTA climb back above the resistance at the $0.4632 level. For this bullish trend to be considered invalid, we would need to see IOTA fall beneath the support at $0.36.
Where Might the Market Be Headed?
Similarly, the Stochastic RSI is in oversold territory and positioned to produce a bullish crossover signal higher. Furthermore, the RSI has recently rebounded from the 50 level, which indicates that the buyers are still in control of the market momentum.
If the bulls can continue to climb higher, they will meet immediate resistance at the bearish .786 Fibonacci Retracement level (drawn in red), priced at $0.4584. This bearish Fibonacci Retracement level is measured from the November 2018 high to the December 2018 low. Above this, further resistance is then located at $0.48 and then at the bearish .886 Fibonacci Retracement level (drawn in red), priced at $0.49.
If the buyers clear the $0.49 level, they will be free to make an attempt at $0.50. For IOTA to reach $0.5, the market will need to increase by a total of 13% from today’s value. Above $0.50, further higher resistance lies at $0.5172 and $0.5329.
VeChain Price Analysis
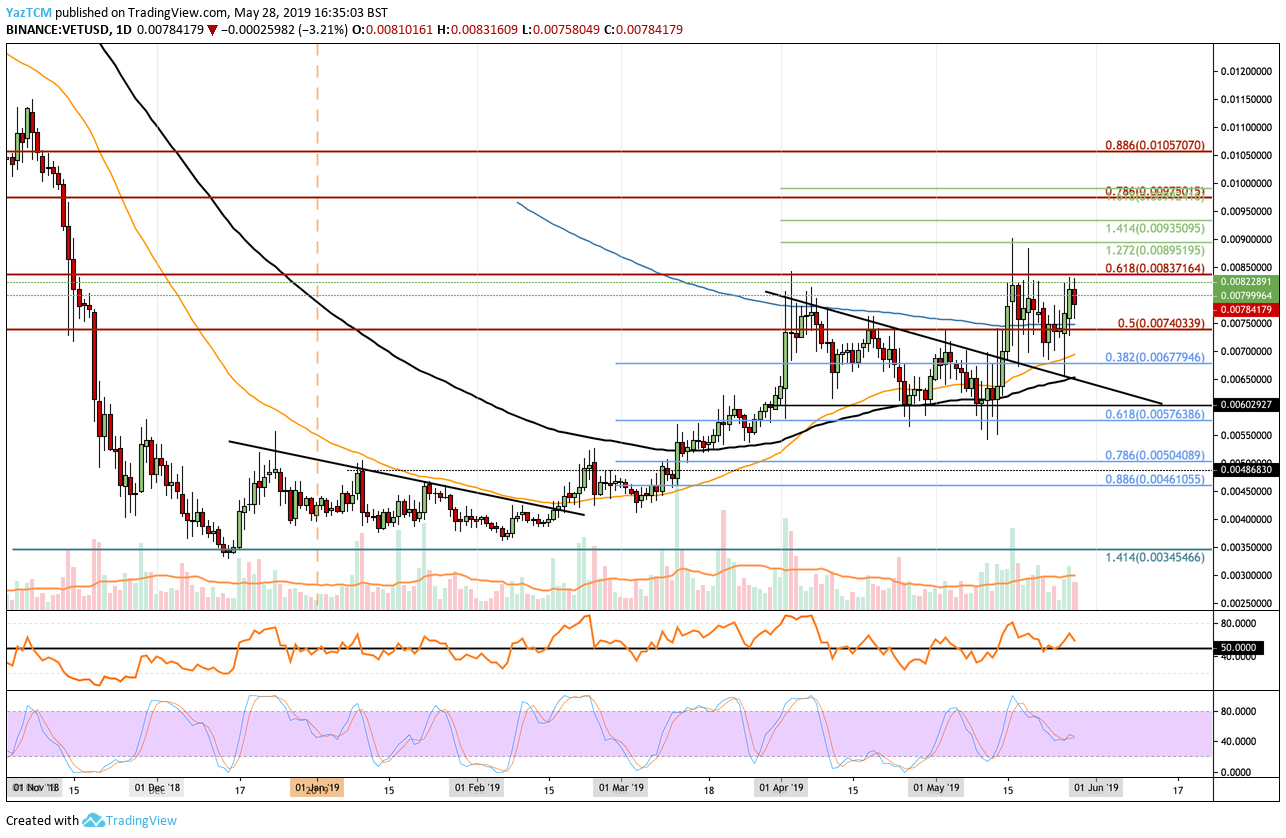
VET/USD – MEDIUM TERM – DAILY CHART
What Has Been Going On?
Analyzing VET/USD from the daily chart above, we can see that VeChain has recently climbed into resistance at the $0.00822 level. The market has struggled to close above this resistance level for the entire of May 2019, but if it can successfully break above, VeChain would be creating a fresh 2019 high.
What Is the Current Trend?
The current trend for VeChain is presently neutral until price action can close above the $0.00822 level. For this market to be considered bearish, we would need to see VET break beneath the $0.0057 support level.
Where Might the Market Be Heading?
If the buyers can break the resistance at $0.00822, they will meet immediate higher resistance at the bearish .618 Fibonacci Retracement level (drawn in red), priced at $0.008371. This bearish Fibonacci Retracement level is measured from the November 2018 high to the December 2018 low.
Further higher resistance above $0.008371 is then expected at the short-term 1.272 and 1.414 Fibonacci Extension levels (drawn in green), priced at $0.008951 and $0.009350 respectively. This is then followed up with some more resistance at the bearish .786 Fibonacci Retracement level (drawn in red), priced at $0.009750. If the market can reach this level, it would have increased by a total of 25%.
Conclusion
All of the three coins analyzed in this article are at critical resistance levels that could see the respective coins climb further higher and create fresh 2019 highs.
We can expect Cardano to increase by a total of 27% to reach $0.1120. However, the cryptocurrency will need to tackle strong resistance at $0.093 and $0.1.
IOTA has a strong potential to increase by a total of 13% to reach the $0.50 level. IOTA will need to overcome resistance at $0.4580 and $0.4903 before reaching this target.
VeChain can increase by a total of 25% to reach $0.009750. However, VeChain will need to contest resistance at $0.008371 and $0.009350 before reaching this target level.