
A veteran trader, who had called the 2018 price drop to below $4,000, has now come out and stated that Bitcoin could be in the midst of entering a new parabolic phase higher.
Peter Brandt has been a trader for over 3 decades in the commodities sector. The trader has written countless books on technical trading, most notably, The Diary of a Professional Commodities Trader. Brandt is one of the trading veterans that has applied his trading knowledge to the cryptocurrency industry.
He Predicted 2018 80% Price Drop
In 2018 Brandt had made a prediction that he expects Bitcoin to drop by over 80% to beneath $4,000 with the following tweet;
General TA rule — violation of parabolic advance leads to 80%+ decline in value. If general rule is followed, BTC should retrace to <$4,000. Note: This Tweet does not make me a hater. pic.twitter.com/jDNI1osinU
— Peter Brandt (@PeterLBrandt) January 22, 2018
At the time his prediction was met with much ridicule from the crypto-sphere which is understandable considering the market was at the tail end of the great 2017/2018 bull run. However over a year later, his prediction has been vindicated as, following his tweet, the market had plummeted by over 80%.
Now Says Bitcoin Enters A New Parabolic Phase
Over the past week Brandt has come forward stating that he believes Bitcoin may be about to enter a fresh parabolic phase with the following tweet,
Either from Dec ’18 low or from retest of same (circa analog dbl bottom in 2015) it would not surprise me if $BTC enters a new parabolic phase. $btcusd pic.twitter.com/XV89Qz7P4n
— Peter Brandt (@PeterLBrandt) April 5, 2019
Brandt had presented a chart of the market cycle since 2014 in which he had drawn a comparison of today’s market to the end of the 2014/2015 bull run. He believes that if the market was to retest the December 2018 low around $3200 he would not be surprised if the market would reverse and enter a fresh bullish phase higher.
The comparison to the 2015 bull run is remarkably similar in which after the market had retested the 2015 label ‘10’, on a double bottom, Bitcoin went on to surge into a new parabolic phase.
However Brandt is not entirely sure if the market will play out in exactly the same way. A couple of days after his first tweet Brandt went on to ask the question regarding whether or not Bitcoin will make a re-test toward 10b or just continue to climb further higher,
Big question re: analog year comparison is whether 10a rally will lead to 10b retest similar to 2013-2015 $BTC pic.twitter.com/BCRKSqBxsP
— Peter Brandt (@PeterLBrandt) April 6, 2019
Let us take a look at the BTC/USD market and highlight some potential areas of support and resistance moving forward.
BTC/USD Price Analysis
BTC/USD – SHORT TERM – DAILY CHART
What Has Been Going On?
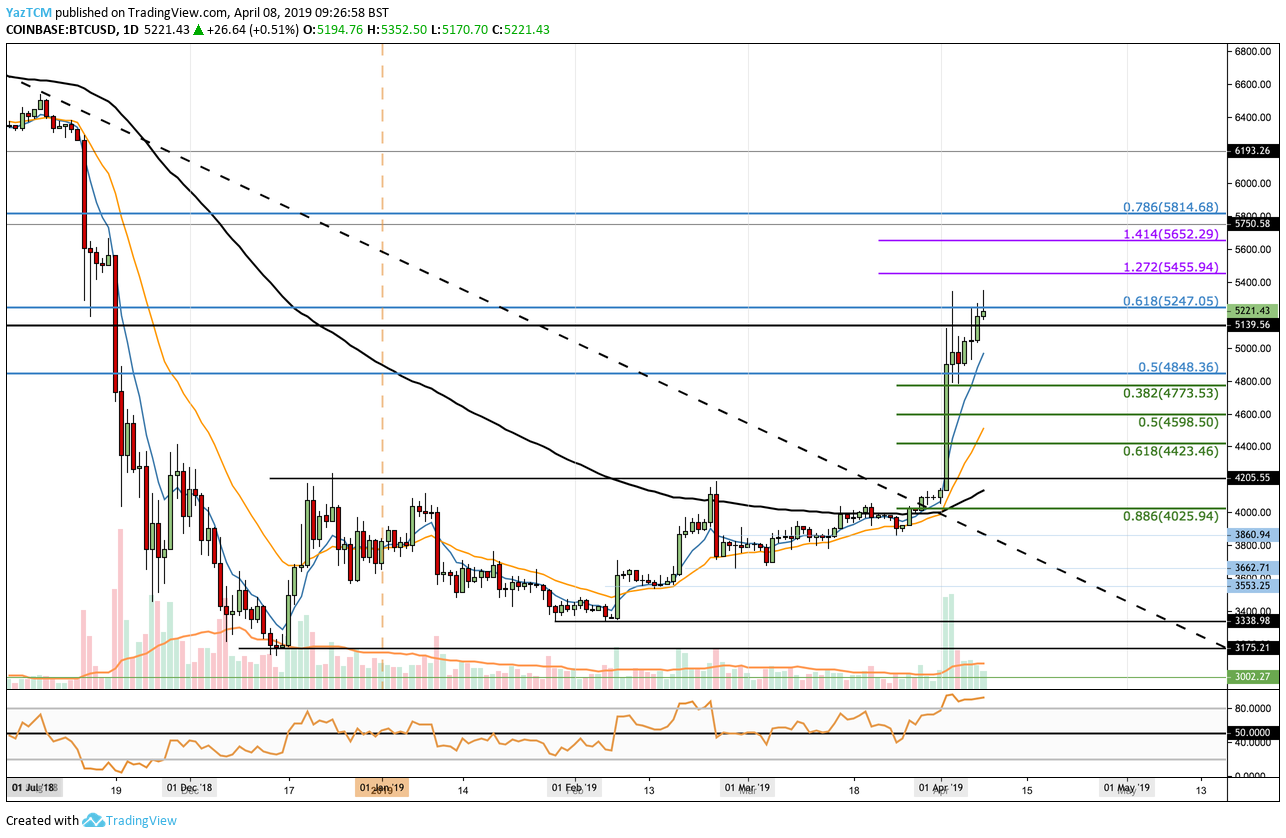
Taking a look at the BTC/USD chart above we can see that toward the end of March 2019 Bitcoin had broken above an 11-month-old falling trend line. At the same time Bitcoin had also managed to climb above the 100 day moving average. These were two incredibly potent bullish signals in quick succession.
Price action has now continued to rise further higher and has recently reached strong resistance at a bearish .618 Fibonacci Retracement level (drawn in blue) priced at $5247. This bearish Fibonacci Retracement level is measured from the November 2018 high, before the November 2018 market bloodbath, to the December 2018 low.
What Is The Current Short Term Trend?
The short term trend for Bitcoin is most certainly bullish. A break beneath $4800 would invalidate this trend.
Where Is The Resistance Above $5247?
Above $5427 we can expect immediate higher resistance to be located at the short term 1.272 and 1.414 Fibonacci Extension levels (drawn in purple) priced at $5455 and $5652, respectively. Above this, higher resistance is then expected at the bearish .786 Fibonacci Retracement level priced at $5814.
If the buyers continue to travel further higher more resistance is expected at the $6000 level.
What If The Bears Regain Control?
Alternatively, if the sellers regroup and begin to push the market lower, immediate support below is located at $5000. Beneath $5000, further support then is expected at $4848, $4600, $4423, and $4200.