
- Golem has created a fresh low at $0.07711 during trading on November 20, 2018.
- Price action has now slipped below $0.10 as the coin trades around $0.087.
- Support moving forward: $0.08631, $0.08077, $0.07528, $0.070, $0.06754, $0.060.
- Resistance moving forward: $0.09772, $0.10, $0.110, $0.1216, $0.13, $0.14, $0.1708, $0.1938.
The Golem project continues to sink like the rest of the cryptocurrency markets, falling a further 11% over the past 24 hours of trading. The GNT cryptocurrency is now trading around the $0.0860 price level, at the time of writing, and has suffered a steep price decline totaling 43% over the past 7 trading days.
Golem is now ranked 52nd in terms of overall market cap rankings, with at total market cap of $82 million. The 24-month old cryptocurrency is now trading at a price that is 92% lower than the all-time high value.
Let us continue to analyze price action over the long term for GNT/USD to gain a sense of the market behavior.
Golem Price Analysis
GNT/USD – LONG TERM – DAILY CHART
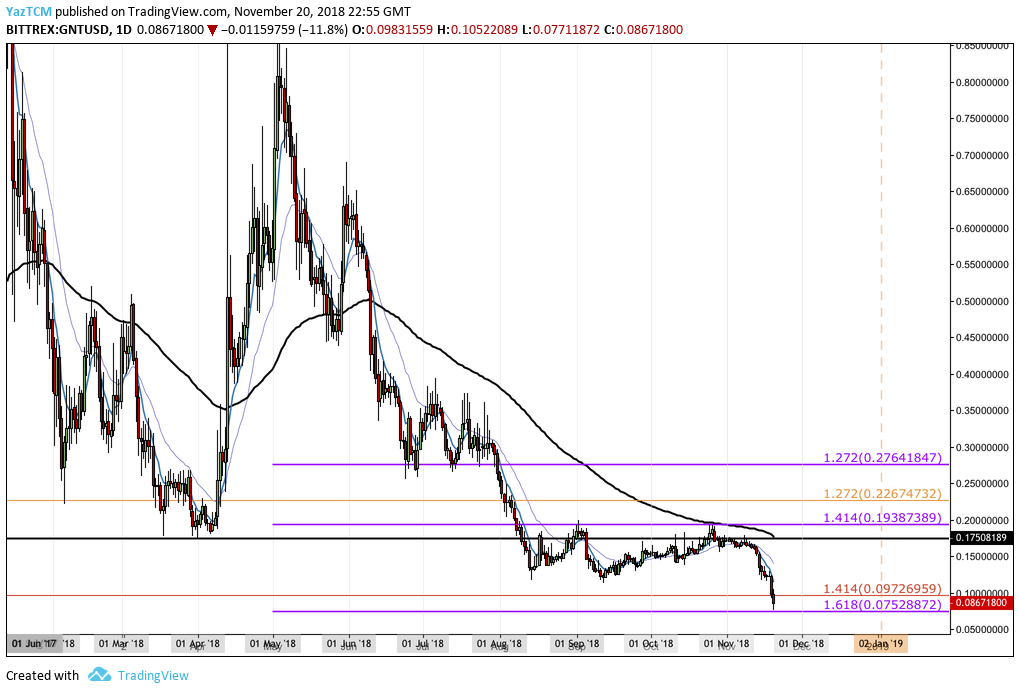
Analyzing price action for GNT/USD over the long term perspective, we can see that the market has been in a constant decline for the majority of the trading year.
The market had created yearly lows during August 2018 as price action broke below $0.17. However, GNT/USD continued to keep falling and has recently reached long-term support at the downside 1.618 Fibonacci Extension level (drawn in purple) priced at $0.7528.
Let us continue to analyze price action a little closer over the medium term and highlight any potential support and resistance zones moving forward.
GNT/USD – MEDIUM TERM – DAILY CHART
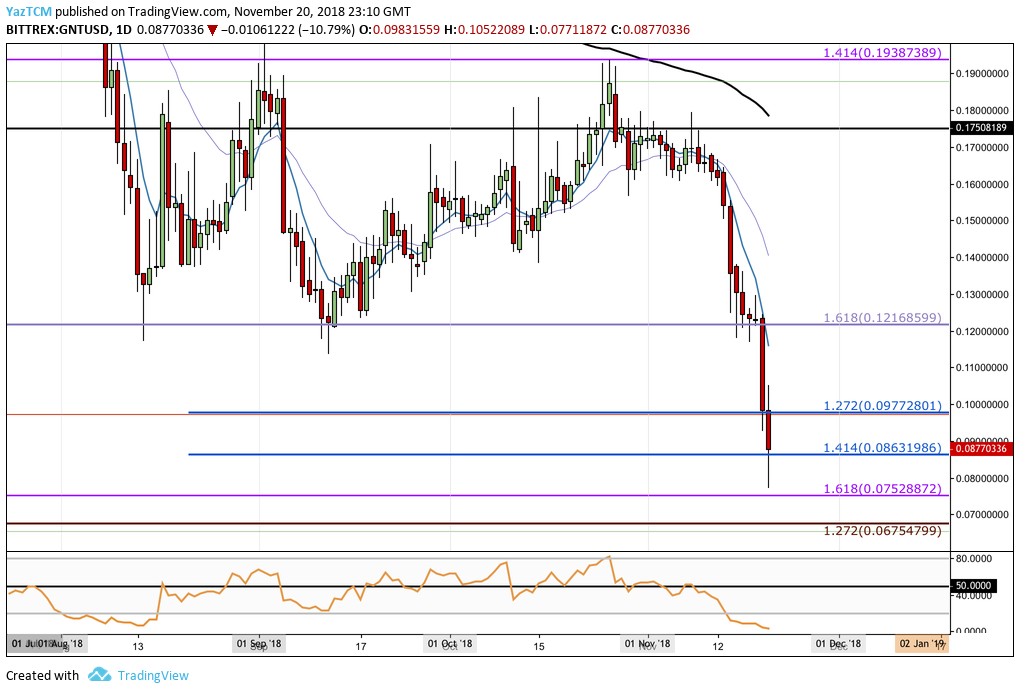
Upon closer inspection of GNT/USD, we can see that price action has found more specific recent support at a short-term downside 1.414 Fibonacci Extension level (drawn in blue) priced at $0.08631.
The market had reached a low of $0.07711 through the recent trading session on November 20, 2018, but the bulls battled to bring the market back above the $0.08631 support.
Moving forward, if the bearish pressure continues throughout the entire industry and GNT/USD breaks below the $0.08631 handle, we can expect immediate near-term support beneath to be located at the psychological round number $0.080 handle, followed by the long-term downside 1.618 Fibonacci Extension level (drawn in purple) priced at $0.07528.
If the bearish momentum continues to drive price action lower, we can expect more support below at the $0.070 handle, followed by a further long-term downside 1.272 Fibonacci Extension level (drawn in dark red) priced at $0.06754. If the sellers continue further below $0.0067, we can expect more support at the $0.065 handle, followed by the $0.060 handle.
On the other hand, if the bulls can hold the $0.08631 support level and push price action higher, we can expect immediate resistance above to be located at the 1.272 Fibonacci Extension level (drawn in blue) priced at $0.09772.
If the market can then continue to climb further above $0.10 and $0.11, we can expect further resistance higher to be located at the previous downside 1.618 Fibonacci Extension level (drawn in lilac) priced at $0.1216.
The RSI has slipped well below the 50 handle into oversold conditions. This indicates that the bears are totally in control of the market momentum. For a sign that the sellers are losing strength, we can look for the RSI to rise back toward the 50 handle once again.
Let us continue to quickly take a close look at GNT/USD and highlight some more potential short-term support levels.
GNT/USD – SHORT TERM – 1HR CHART
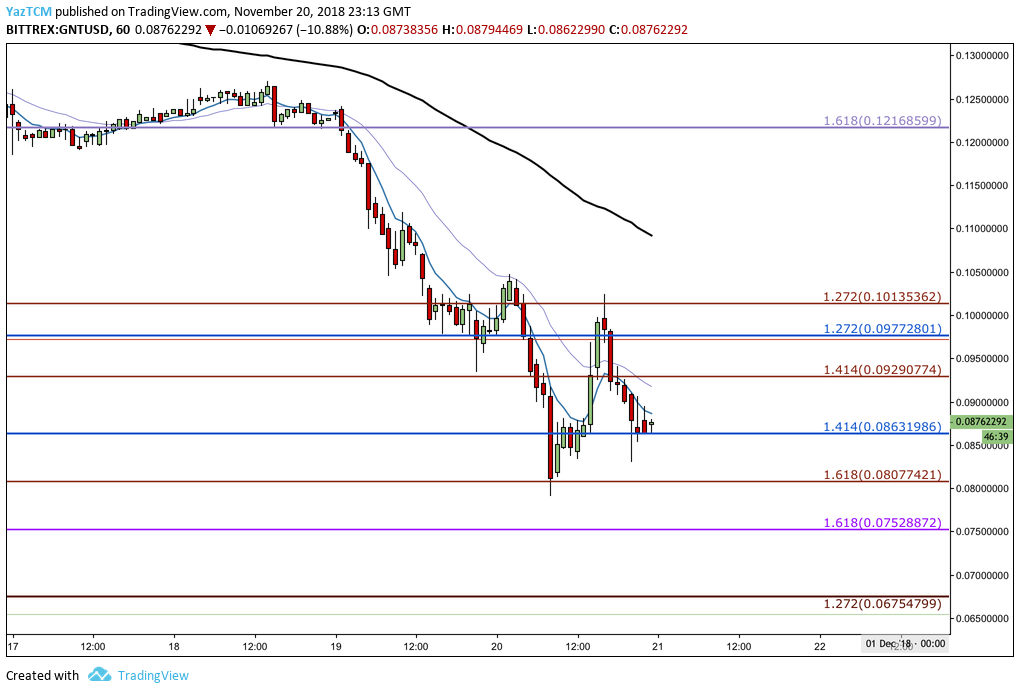
Analyzing the market from the 1HR perspective above, we can see that during the major sell-offs on November 20, 2018 the market had found support at a shor- term downside 1.618 Fibonacci Extension level (drawn in red) priced at $0.08077.
If the bears break below the current support at $0.08631, we will expect support immediately below to be located at the $0.08077 handle.
Let us continue to analyze price action for GNT/BTC over the long term and gain an insight on the market movements.
GNT/BTC – LONG TERM – DAILY CHART
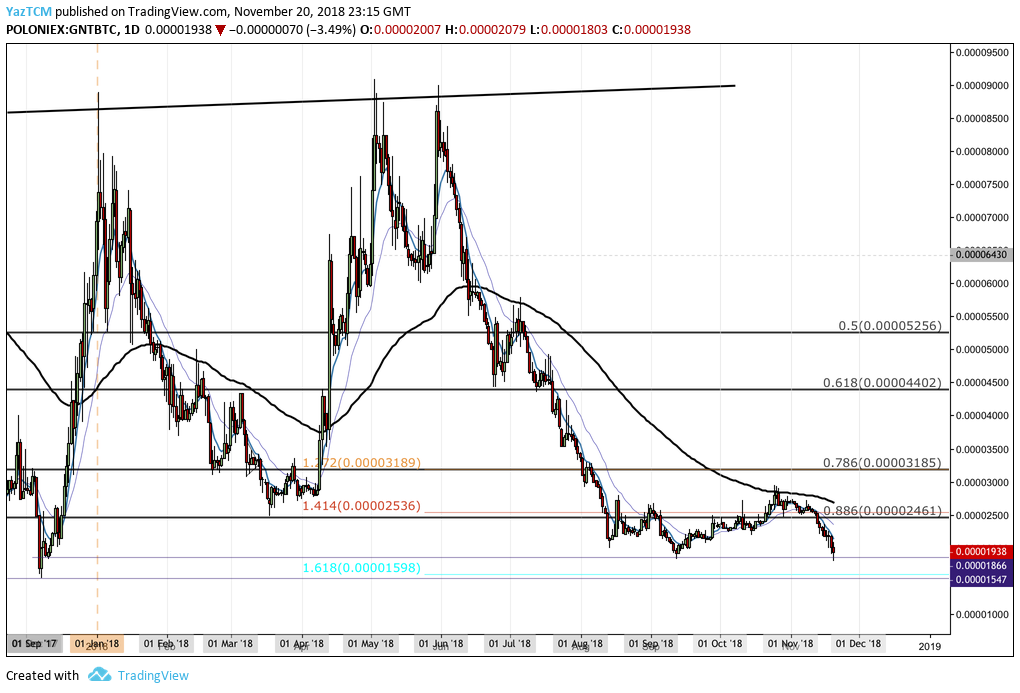
Taking a look at GNT/BTC over the long term, we see that the market has been consistently declining since June 2018. Price action has recently created a fresh yearly low as it touched the 1,803 SATS handle on November 20, 2018.
However, Golem holders will be relieved to hear that price action has still not broken below December 2017’s low which is priced at the 1,547 SATS handle.
Let us look a little closer at price action for GNT/BTC over the short term and highlight any potential support and resistance zones.
GNT/BTC – SHORT TERM – DAILY CHART
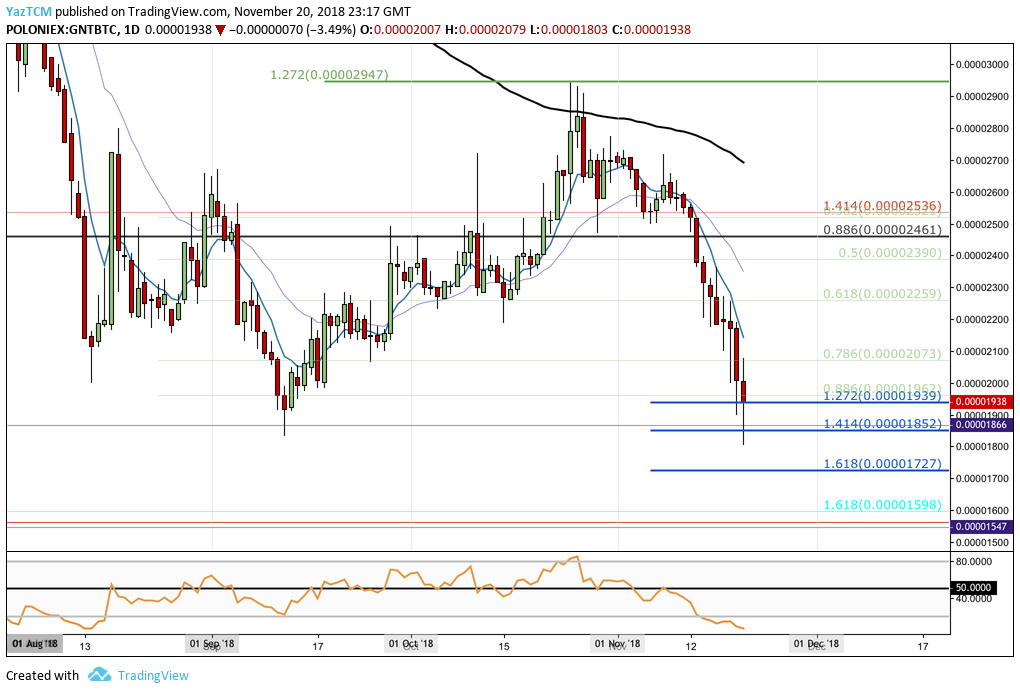
Taking a closer look at a GNT/BTC, we can see that the market is currently resting at support provided by the short-term downside 1.272 Fibonacci Extension level (drawn in blue) priced at 1,939 SATS.
Price action had dropped close to the December 2017 low but the bulls re-entered the market to bring it above the 1,939 SATS support level.
Moving forward, if the sellers continue to push GNT/BTC below the support at 1,939 SATS, we can expect immediate support bellow to be located at the short-term downside 1.414 Fibonacci Extension level (drawn in blue) priced at 1,852 SATS.
If the bearish momentum continues and the sellers drive GNT/BTC below 1,800 SATS, we can then expect further support below at the downside 1.618 Fibonacci Extension level (drawn in blue) priced at 1,727 SATS.
On the other hand, in our bullish scenario, if the buyers continue to hold at the support provided by 1,939 SATS and manage to bring price action above 2,000 SATS, we can expect immediate resistance above to be located at the .786 and .618 Fibonacci Retracement levels (drawn in green), priced at 2,073 SATS and 2,259 SATS respectively.
The RSI is also trading within extreme oversold conditions within this market. If we are to see a recovery, we would need to see the RSI make its way back toward the 50 handle once again.