
- GNT/USD has rebounded from its 2018 low of $0.055.
- The market has met resistance at $0.08427, and retraced to where it is currently trading at $0.065.
- Support moving forward: $0.06009, $0.05509, $0.05073, $0.045, $0.04235
- Resistance moving forward: $0.06589, $0.06937, $0.07284, $0.08427, $0.09217, $0.09632, $0.10.
Golem (GNT) Price Analysis
Over the past 24 hours of trading, Golem has fallen by a total of 4.51%, bringing the price for the cryptocurrency down to $0.06525, at the time of writing.
Golem has seen a 9.12% decline over the previous 7 trading days after a steeper price drop totaling 25% over the past 30 trading days.
The Golem project is now ranked in 61st position and presently holds a $61 million market cap value. The 25-month old cryptocurrency has seen a precipitous price plummet over the previous 90 trading days which totals 58% as the storage-oriented blockchain project now trades at a value that is 94% lower than the all-time high price.
GNT/USD – SHORT TERM – 4HR CHART
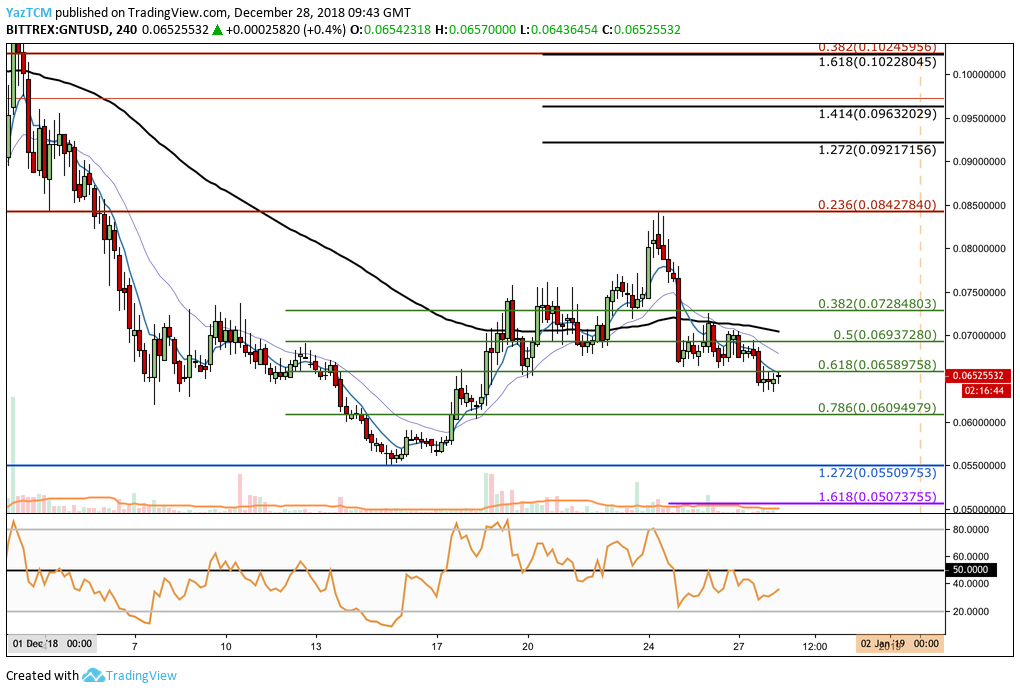
Taking a look at the GNT/USD 4-hour chart above, we can see that Golem has positioned itself at a yearly low during December as it hit a price of $0.055. As price action hit this price level, the market proceeded to reverse and began to rally during the second half of December 2018.
GNT/USD surged until it met resistance at the bearish .236 FIbonacci Retracement level (drawn in red) priced at $0.08427 before the price surge stalled and reversed. This Fibonacci Retracement is measured from the high of $0.17 seen during November 2018 to the low of $0.055 seen during December 2018.
The market has now retraced and is trading marginally below the short-term .618 Fibonacci Retracement level (drawn in green) priced at $0.06589.
Trend: Bearish
As the market failed to create a higher high during December 2018, the market is still within a bearish trend. Although the short term trend is currently neutral, the bearish trend will resume if price action breaks back below the $0.060 handle.
For GNT/USD to be considered bullish in the short term we would need to see price action break above the resistance provided by the bearish .236 Fibonacci Retracement (drawn in red) priced at $0.08427.
Where is the Support for GNT Beneath $0.065?
If the sellers continue to force GNT/USD to head lower, we can expect immediate support to the downside to be located at the short-term .786 Fibonacci Retracement level (drawn in green) priced at $0.06094.
Further support below this can be located at the yearly low which is supported by the long-term downside 1.272 Fibonacci Extension level (drawn in blue) priced at $0.05509.
If the bears continue to cause GNT/USD to fall below $0.055 and create fresh 2018 lows, we can then expect further support beneath to be located at the short-term downside 1.618 Fibonacci Extension level (drawn in purple) priced at $0.05073.
What If the Bulls Push the Market Above $0.065?
If the buyers can regroup and begin to drive price action back above the resistance at the short-term .618 Fibonacci Retracement level (drawn in green) priced at $0.06589, we can expect further higher resistance to be located at the short-term .5 and .382 Fibonacci Retracement levels (drawn in green), priced at $0.06973 and $0.07284 respectively.
Further resistance above this will then be located at the medium-term bearish .236 Fibonacci Retracement level (drawn in red) priced at $0.08427.
If the bulls can continue to press higher and climb above $0.090, more resistance above can be located at the short-term 1.272 and 1.414 Fibonacci Extension levels (drawn in black), priced at $0.09217 and $0.09632 respectively.
Let us continue to take a look at GNT/BTC over the short term and highlight any possible support and resistance areas moving forward.
GNT/BTC – SHORT TERM – 4HR CHART
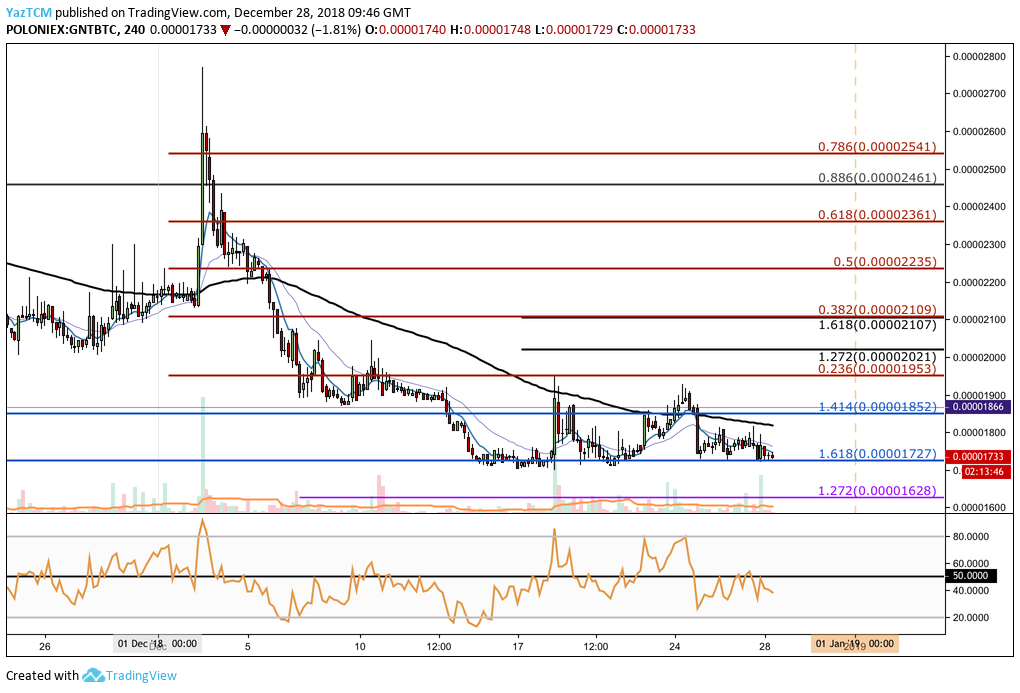
Analyzing GNT/BTC from the 4-hour perspective above, we can see that the market had reached our expected long-term support provided by the downside 1.618 Fibonacci Extension level (drawn in blue), priced at 1,727 SATS.
After rebounding from this level, the market attempted to climb higher but reached resistance at the bearish .236 Fibonacci Retracement level (drawn in red) priced at 1,953 SATS. This Fibonacci Retracement is measured from the high to low seen during December 2018.
Trend: Bearish
The overall trend for GNT/BTC is still extremely bearish. If the market continues to break below the support at 1,727 SATS, we could see price action head further lower.
For a recovery to be seen within GNT/BTC, we would need to see price action to firstly climb above the 2,000 SATS handle.
Where is the Support Located for GNT Below 1,727 SATS?
If the bears continue to drive price action lower and penetrate below the 1,727 SATS handle, we can expect immediate significant support beneath to be located at the psychological round number handle at 1,500 SATS.
What If the Bulls Regather Momentum and Push Higher?
If the buyers can begin to push price action higher, they will meet immediate resistance toward the upside at the previous downside 1.414 Fibonacci Extension level (drawn in blue) priced at 1,852 SATS.
This is closely followed by the bearish .236 Fibonacci Retracement level (drawn in red) priced at 1,953 SATS.
Further resistance above this can then be expected at the short-term 1.272 and 1.414 Fibonacci Extension levels (drawn in black), priced at 2,021 SATS and 2,107 SATS respectively.
If the bulls continue to press higher, then more resistance toward the upside will be located at the bearish .5 and .618 Fibonacci Retracement levels (drawn in red,) priced at 2,235 SATS and 2,361 SATS, respectively.
Conclusion
Like the majority of cryptocurrencies, Golem has not had the prettiest year considering its 94% drop from its all-time high price. The cryptocurrency is considerably struggling making any gains against Bitcoin, and this is what is suppressing the GNT/USD price level greatly.
If price action for GNT/BTC drops below the support at 1,727 SATS, we could see GNT/USD create fresh yearly lows once again.