
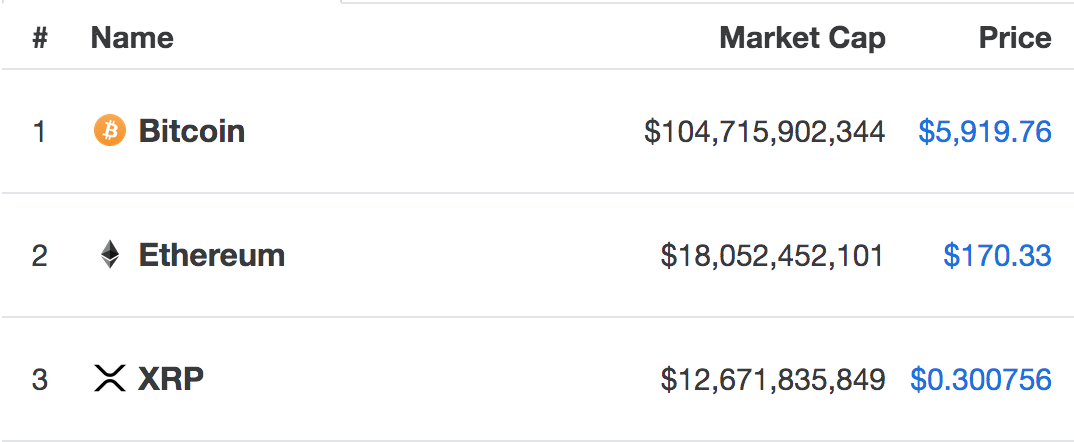
Ethereum has seen a wonderful 90 days of positive price growth where the coin has surged by a total of 59%. However, after reaching resistance around the $185 level and witnessing a 3% price fall over the past 24 hours, Ethereum is now trading at a price of $170. The cryptocurrency is now ranked in 2nd position in the market cap rankings, as it currently holds an $18.06 billion market cap valuation.
In this article, we will take a look at Ethereum’s potential to reach the $194.60 level by the end of the week. $194.60 has been chosen, as it is a level of relatively strong resistance which has been provided by a long-term bearish .786 Fibonacci Retracement level that has been measured from the November 2018 high to the December 2018 low.
The recent price drop comes after a report from Binance stating that their hot wallet had been hacked and over 7m000 BTC were stolen from the exchange. Interestingly, the exact same hack had previously happened in July 2018.
Furthermore, over the course of 2019, Ethereum has been significantly struggling against Bitcoin. Ethereum started the year against Bitcoin at a price around 0.04 BTC. However, as the year progressed, despite rising Bitcoin prices, the Ethereum market continued to fall lower against Bitcoin, and is currently trading around the 0.028 BTC level.
Ethereum Price Analysis
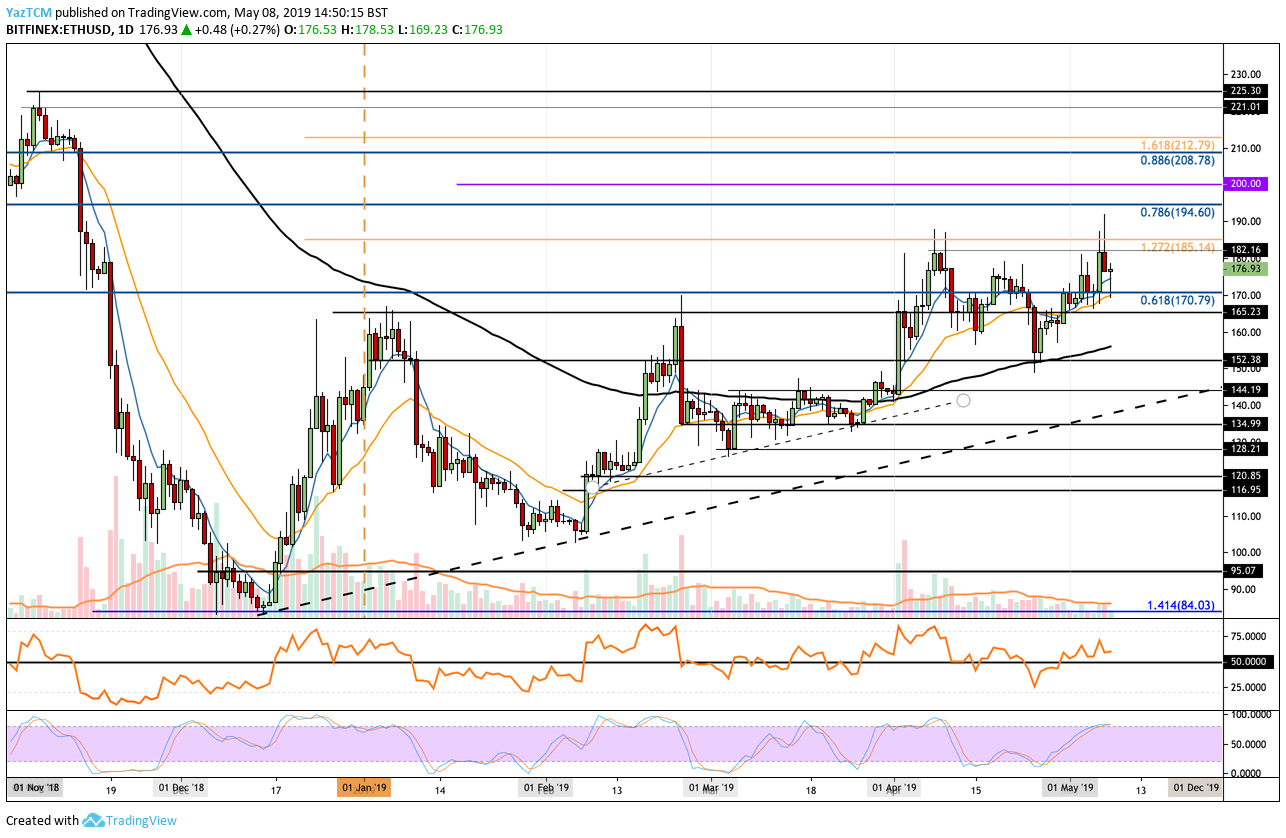
ETH/USD – MEDIUM TERM – DAILY CHART
What Has Been Going On?
Taking a look at the ETH/USD daily chart above, we can see that the market has now returned to resistance at the $185 level. This level provided significant resistance for the market during April 2018 and therefore will require significant momentum to overcome. The resistance is provided by a 1.272 Fibonacci Extension level (drawn in orange) priced at $185.
What Is the Current Short-Term Trend?
At this moment in time, the current short-term trend for ETH/USD is neutral. The market will need to overcome the resistance at $185 to turn bullish. If price action was to fall below $150, the market would turn bearish.
Where Can We Go From Here?
If the buyers manage to break above the resistance at $185, we can expect immediate higher resistance then to be located at $190. Above $190 lies our target resistance for the end of the week at $194. We can see the bearish .786 Fibonacci Retracement level (drawn in blue), positioned in this area at $194.60.
If the bulls continue above $194.60, the next level of serious resistance is then located at the $200 level. This is followed with resistance at the nearish .886 Fibonacci Retracement level (drawn in blue), priced at $208.
What If the Bears Regain Control?
Alternatively, if the selling pressure continues within Bitcoin, and Ethereum continues to depreciate against Bitcoin, we can expect immediate support beneath the market to be located at $170. Beneath $170, further support lies at $165, $154 (contains the 100 day moving average level), and $150.
What Are the Technical Indicators Showing?
The RSI has recently peaked above the 50 level, which indicates that the bulls have recently taken control of the market momentum. However, the Stochastic RSI is preparing for a crossover below in overbought conditions, which could indicate that a retracement is on the cards for Ethereum.
Conclusion
For Ethereum to reach the target at $195, the market will have to increase by a total of 10% from the current price. This is a very reasonable goal for Ethereum to achieve by the end of the week. However, with further details of the overarching Binance hack to be revealed, combined with continuing falling prices of Ethereum against Bitcoin, it may turn out to be hard going for Ethereum.