
- Support for ETH moving forward: $115.96, $110.46, $102.55, $101.27, $100, $93.00, $84.03.
- Resistance for ETH moving forward: $124.91, $134.67, $146.74, $150, $155.12, $171.94.
Latest Ethereum News
After the delay in the Ethereum Constantinople upgrade, it was found that some Ethereum miners were mining on an unofficial chain after not following advice from developers. The hash power, at one point, actually exceeded the amount of hash power of the Ethereum Classic chain.
The new scheduled date for the Constantinople upgrade is in late February 2019 after the blockchain hits block number 7,280,000.
ETH/USD Price Analysis
Ethereum has seen a price fall totaling 9.16% over the past 7 trading days as the current price of the cryptocurrency is now around the $117.46 handle, at the time of writing. The market is still up by a total of 4.53% over the past 30 trading days.
Now ranked in 3rd position, Ethereum holds a $12.22 billion market cap valuation. The decentralized operating system has seen a serious price drop totalling 42% over the past 90 trading days as the 41-month old project now trades at a price that is 91% lower than its all-time high price.
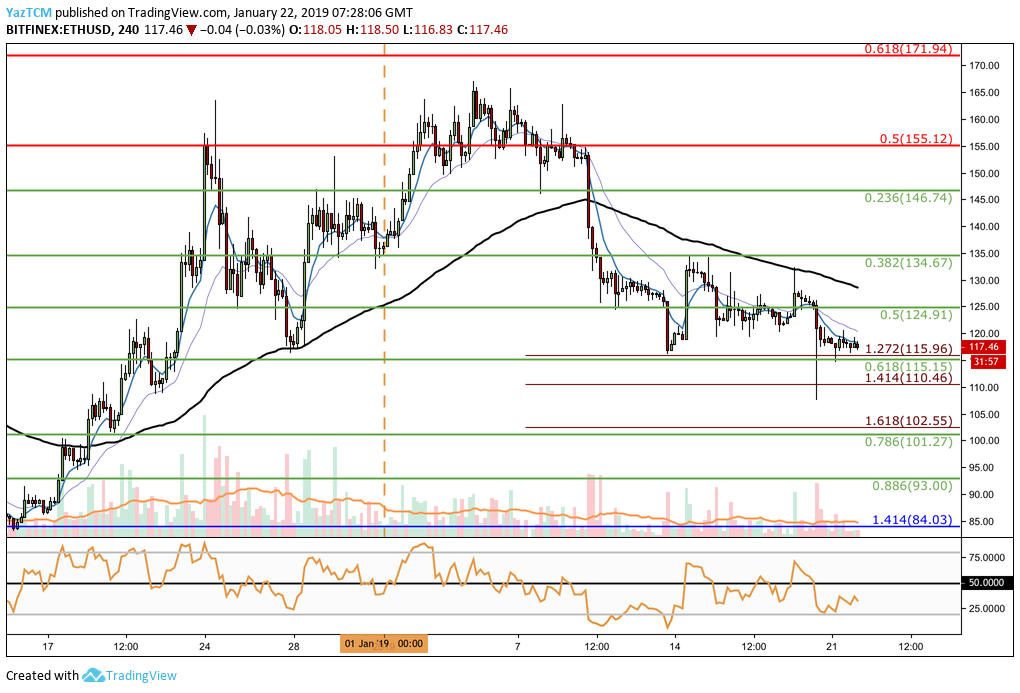
Taking a look at the 4-hour chart above for ETH/USD, we can see that price action has now approached the previously highlighted support zone at the short-term .618 Fibonacci Retracement level (drawn in green) priced at $115.
This area of support is further bolstered by a short-term downside 1.272 Fibonacci Extension level (drawn in red) priced in the same area.
Trend: Neutral
The trend is still in a neutral trading condition at this moment in time. However, if price action does break below the $115 handle, the short-term trading condition for ETH/USD will turn bullish.
Where is the Support Below the $115 Handle?
If ETH/USD can break below the $115 handle, we can expect immediate support below to be located at the short-term downside 1.414 and 1.618 Fibonacci Extension levels (drawn in red), priced at $110.46 and $102.55 respectively.
Further support below this will then be expected at the short-term .786 Fibonacci Retracement level (drawn in green) priced at $101.27. I
f the selling pressure causes ETH/USD to break below the $100 handle, more support below is located at the short-term .886 Fibonacci Retracement level (drawn in green) priced at $93. This is closely followed by the long-term downside 1.414 Fibonacci Extension level (drawn in blue) priced at $84.03.
Where is the Resistance Towards the Upside?
Alternatively, if the bulls regroup and begin to push price action higher for ETH/USD, we can expect immediate resistance above to be located at the short-term .5 and .382 Fibonacci Retracement levels (drawn in green), priced at $124.91 and $134.67.
The resistance at $134.67 is also the upper boundary of the trading range that was outlined in our previous ETH/USD analysis.
If ETH/USD can break above the upper boundary of the trading range, expect higher resistance at the short-term .236 Fibonacci Retracement level (drawn in green) priced at $146.74.
Above the $150 handle, we can expect more higher resistance at the bearish .5 and .618 Fibonacci Retracement levels (drawn in red) priced at $155.12 and $171.94, respectively.
ETH/BTC Price Analysis
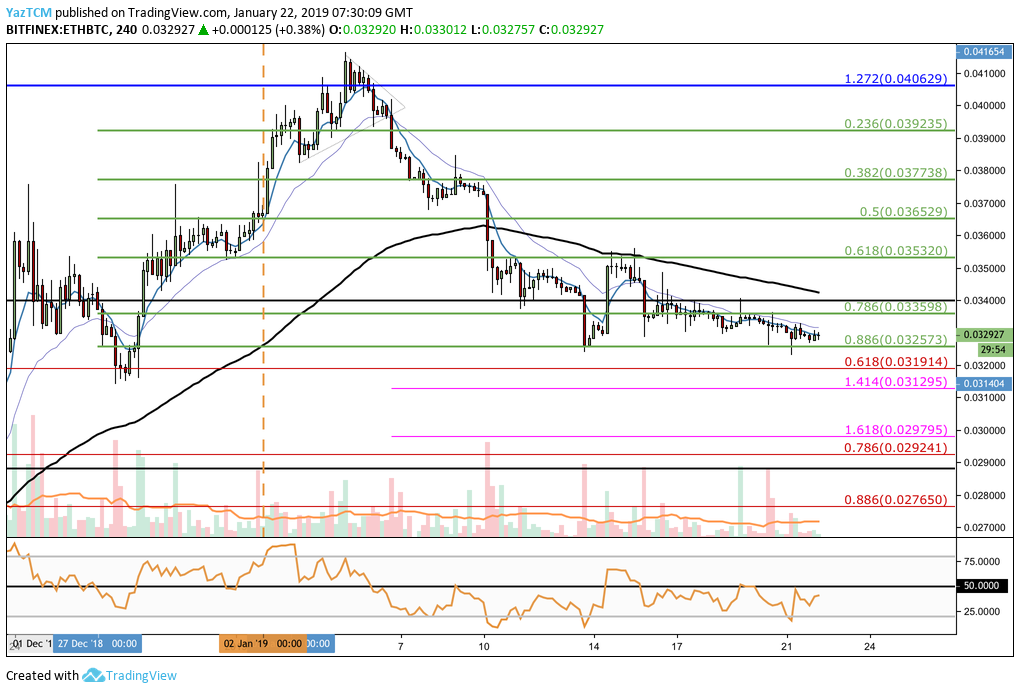
Taking a look at the ETH/BTC 4-hour chart above, we can see that price action has also reached further support below at the short-term .886 Fibonacci Retracement level (drawn in green) priced at 0.03257 SATS.
Price action is still within the bounds of the current trading range between 0.03257 SATS and 0.03532 SATS.
Trend: Neutral
The current trading trend will remain neutral until price action manages to break below the lower boundary of the aforementioned trading range.
Where is the Support Located if the Market Breaks Below the Trading Range?
If ETH/BTC falls below the trading range, we can expect immediate support towards the downside to be located at the medium-term .618 Fibonacci Retracement level (drawn in red) priced at 0.03191 SATS.
Further support below can then be located at the short-term downside 1.272 and 1.414 Fibonacci Extension levels (drawn in pink), priced at 0.03129 and 0.02979 SATS respectively.
If the selling pressure causes ETH/BTC to head even lower, more support is located at the medium-term .786 and .886 Fibonacci Retracement levels (drawn in red), priced at 0.02924 SATS and 0.02765 SATS respectively.
Where is the Resistance Towards the Upside?
Alternatively, if the bulls regroup and begin to push price action higher from the .886 Fibonacci Retracement support level, we can expect immediate higher resistance at the short-term .786 and .618 Fibonacci Retracement levels (drawn in green), priced at 0.03359 SATS and 0.03532 SATS respectively.
If ETH/BTC goes higher, more resistance above can be found at the short-term .5 and .382 Fibonacci Retracement levels (drawn in green), priced at 0.03652 SATS and 0.03778 SATS respectively.
More resistance above 0.03778 SATS can then be expected at the short-term .236 Fibonacci Retracement level (drawn in green) priced at 0.03923 SATS. This is closely followed by more resistance at the short-term 1.272 Fibonacci Extension level (drawn in blue) priced at 0.04062 SATS.
Conclusion
Ethereum is trading at the lower boundary of the trading range at this moment in time.
If the sellers push price action below the $115 handle, we can expect ETH/USD to head further lower towards the $110 – $101 range.