
- Support for ETH moving forward: $106.99, $102.98, $101.27, $100, $95.15, $93.00.
- Resistance for ETH moving forward: $109.78, $110.46, $115.15, $124.91, $134.67.
Ethereum Price Analysis
Ethereum has seen a small price increase over the past 7 trading days totaling 2.39%, bringing the current trading price up to around $108.40, at the time of writing. The cryptocurrency is still down by a total of 27% over the past trading month.
Ethereum remains in 3rd position as it holds a $11.27 billion market cap valuation. The decentralized operating system has lost a total of 48% over the past 90 trading days as the 42-month old project now trades at a value that is 92% lower than the all-time high price.
ETH/USD Price
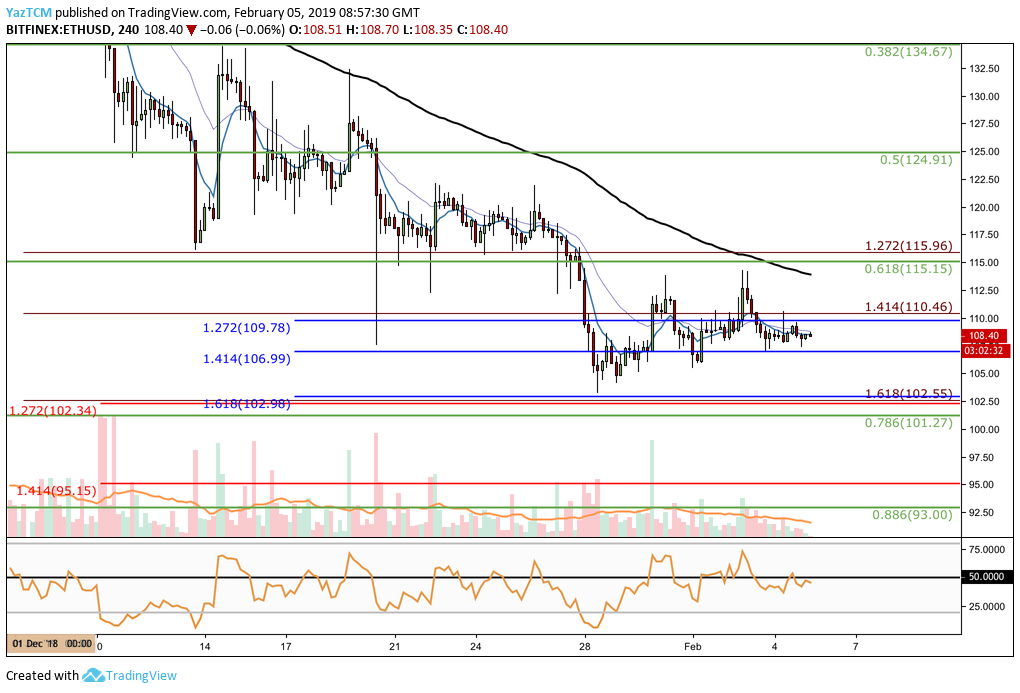
Taking a look at the 4HR chart above, we can see that since our last analysis for Ethereum, price action has managed to remain above the short-term downside 1.414 Fibonacci Extension level (drawn in blue) priced at $106.99.
The market has managed to create a minor higher high as it approached the $115 handle but failed to continue higher and rolled over once again. Price action is now currently trading at support provided by the $106.99 handle.
Trend: Bearish
The overall trend is still bearish, however, price action has managed to trade sideways over the past few trading sessions creating a short term neutral condition. For this market to be considered bullish, price action must now break above $115 to create a higher high.
Where Is The ETH/USD Market Likely to Head Towards Next?
If the support at $106.99 can hold and the bulls begin to push price action higher, we can expect immediate resistance above at the short-term downside 1.272 Fibonacci Extension level (drawn in blue) priced at $109.78.
Further resistance above can then be expected at the $115 level which is closely followed by resistance at the short-term .618 Fibonacci Retracement level (drawn in green) priced at $115.15.
If the bullish pressure can continue further higher to break above $120, there is higher resistance at the short-term .5 and .382 Fibonacci Retracement levels (drawn in green) priced at $124.91 and $134.67, respectively.
What if the Bears Push the ETH Market Below $106.99?
Alternatively, if the sellers step in and push price action below the support at $106.99, we can expect immediate support below at the short-term downside 1.618 Fibonacci Extension level (drawn in blue) priced at $102.98.
If the selling pressure continues to drive price action lower, more support can then be expected at the short-term .786 Fibonacci Retracement level (drawn in green) priced at $101.27. This is closely followed by more support at the psychological round number handle at $100.
If the bears break below the $100 handle, we can then expect more support beneath at the medium-term downside 1.414 Fibonacci Extension level (drawn in red) priced at $95.15. This is followed by more support at the short-term .886 Fibonacci Retracement level (drawn in green) priced at $93.00.
Conclusion
Ethereum is battling against the bears to prevent further market declines.
The support at $106.99 will now be crucial to prevent the market from heading toward the $100 handle. If price action can break above the $115 handle, this can be considered a promising sign for Ethereum in the short term.