
The market sentiment has seen a slight change over the past few weeks from a very negative bearish sentiment to one of hopeful optimism. The majority of the top 10 cryptocurrencies (excluding Bitcoin and Tether) have all seen increase 90-day price increases which all total over 50%. In fact, Litecoin and Binance Coin have 90-day price increases which surpass the 100% mark.
One particular coin which has enticed the optimism of many speculators is Ethereum. Research from DelphiDigital has suggested that Ethereum may even outperform Bitcoin in the next bull run, so long as the bull run occurs in the near time horizon.
The research has suggested that Ethereum currently has higher volatility when compared with the volatility of Bitcoin.
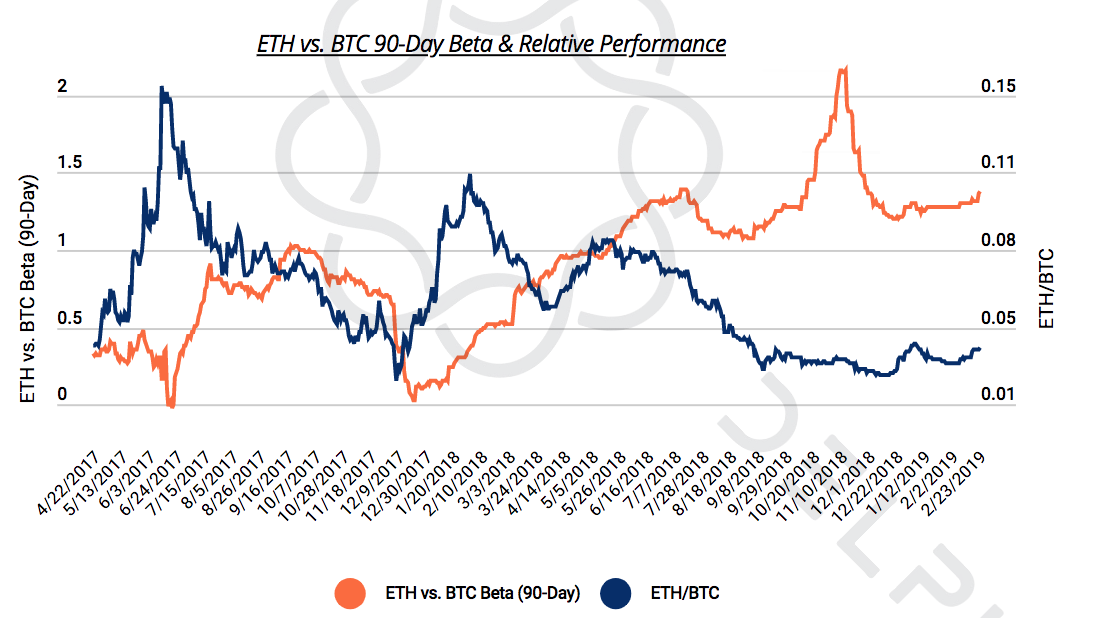
The chart above demonstrates that Etheruem has been significantly more volatile than Bitcoin over the past 6 months. This can be seen through the improved Beta that Ethereum has against Bitcoin. The Beta value measures a coins volatility in relation to that of the market. A value above 1 would indicate that Ethereum is more volatile than the market (Bitcoin) and a value below 1 indicates that Ethereum is much less volatile than the market (Bitcoin).
The chart above not only shows that Ethereum has been significantly more volatile than Bitcoin over the past 6 months but it also shows that the Beta for ETH vs BTC is now sitting at a value close to 1.5 which indicates a higher than average level of volatility in Etheruem when compared with Bitcoin.
Other research has suggested that Ethereum tends to outperform Bitcoin when intra-market correlations drop, as evidenced from the chart below;
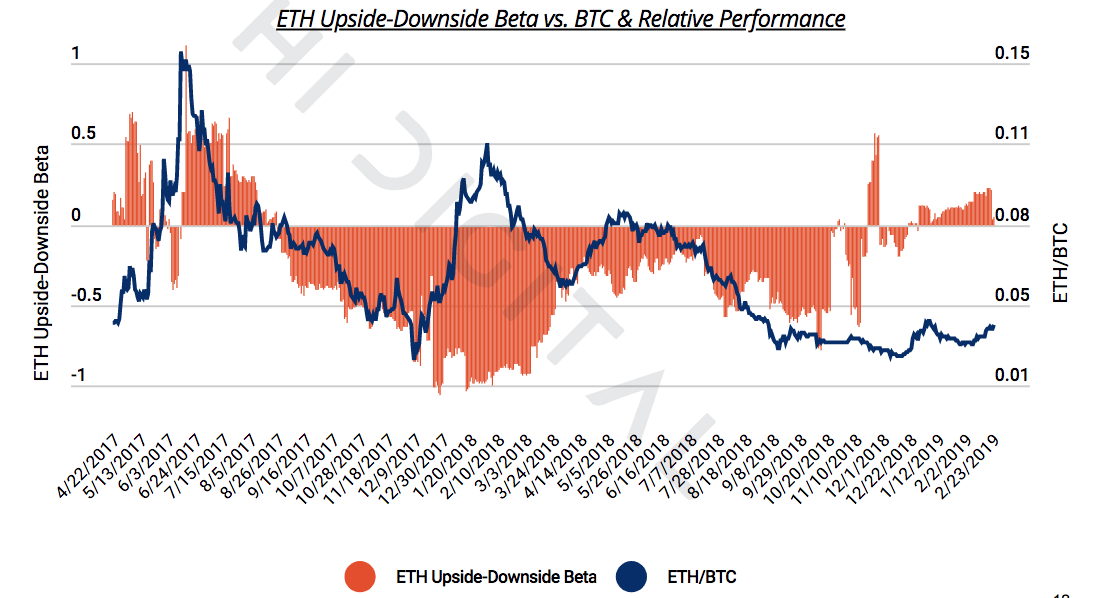
The combination of the increased volatility for Ethereum relative to Bitcoin would suggest that the intra-market correlations have started to see a shift away from 1, meaning the market is becoming less correlated.
From this, we can deduce that the combination of the intra-market correlation falling and the fact that Etheruem tends to outperform Bitcoin when the intra-market correlation drops may suggest that if a bull market does erupt in the near future, we could potentially see Ethereum making significantly higher gains relative to Bitcoin.
Let us take a quick look at the Ethereum market and highlight some potential areas of significant resistance that the market will need to overcome moving higher.
Ethereum Price Analysis
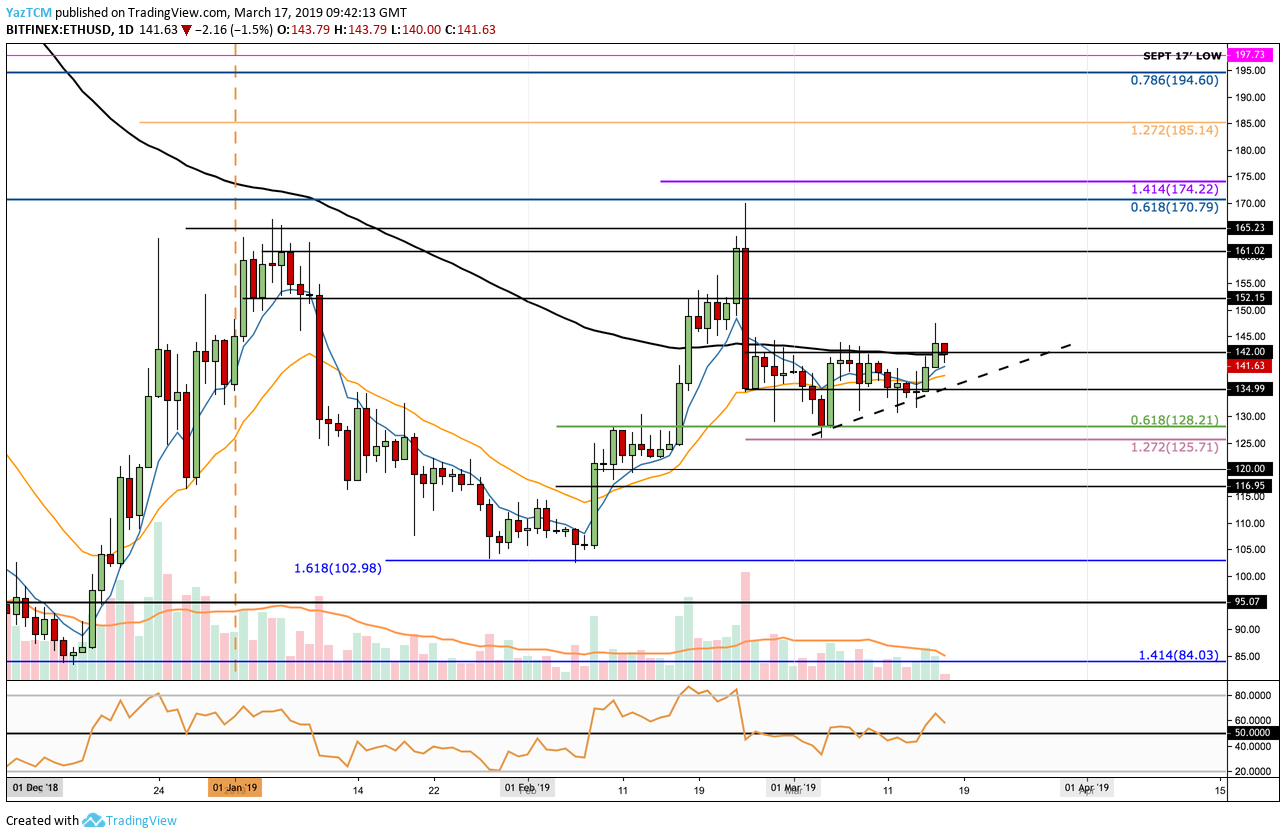
Taking a look at the daily chart above, we can see that Etheruem has recently broken above strong resistance at the $142 level. The market has been struggling to break above this level for the entirety of March 2019 as the resistance was bolstered by the 100-day moving average which was floating at the same level.
Toward the upside, higher resistance lies at the $152, $161 and $165 levels. If the bulls can continue to break above $170, more resistance can be expected at $174, $185 and $194 before the $200 will be re-tested.
Alternatively, if the sellers push the market lower initial support is expected at $135. Below $135, support lies at $128, $125, $120 and $116.
The RSI has recently broken above the 50 level which indicates that the bulls have claimed control of the market momentum. If the RSI can remain above 50 and travel higher, we could see Etheruem making its way toward the $200 level.