
Ethereum Price Analysis
Ethereum price continues to surge higher after increasing by 7.66% over the previous 24 hour trading session, bringing the current trading price up to around $150.90, at the time of writing. The market has now seen an impressive rally totaling 23% over the past 7 trading days.
Ethereum remains ranked in 2nd position as it presently holds a $15.54 billion market cap valuation. The 42-month old project now trades at a value that is 89% lower than its all time high price.
Let’s take a look at the ETH/USD market and try to ascertain how high this market may climb in the coming weeks.
ETH/USD Price
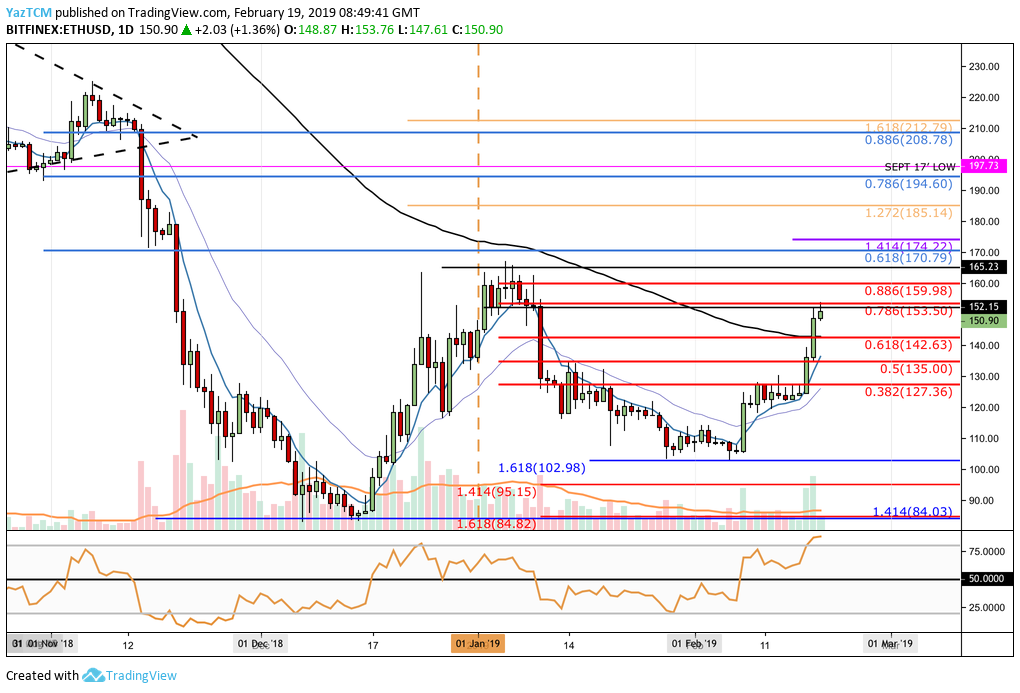
Taking a look at the daily ETH/USD chart above from the long-term perspective, we can see after the market had rebounded at the downside 1.618 Fibonacci Extension level (drawn in blue) priced at $102.98 in early February 2019, it has continued to surge significantly higher and has recently broken above the $150 level.
Price action recently reached resistance at a short-term bearish .786 Fibonacci Retracement level (drawn in red) priced at $153.50 before the rally stalled. This bearish Fibonacci Retracement is measured from the January 2019 high to the February 2019 low.
Price action has now also recently climbed above the 100-day moving average for the first time since April 2018. This could be the first strong signal that the bearish trend has come to an end.
Trend: Bullish
The trend remains strongly bullish as price action has been creating higher highs throughout February 2019.
The next level of resistance that the market will need to climb above to keep the bullish trend going is located at the January 2019 high around the $165.25 level.
Where is the Market Likely to Head Towards Next?
If the amazing bullish momentum continues to push price action above the current resistance level at the $153 handle, we can expect immediate higher resistance to be located at the short-term bearish .886 Fibonacci Retracement level (drawn in red) priced at $159.98. This is followed by resistance at the January 2019 high at the $167 handle.
If the bulls can continue to break above $167 to create a fresh 2019 high, there is more resistance above located at the long-term bearish .618 Fibonacci Retracement level (drawn in blue) priced at $170.79.
If the buyers continue to climb above the $180 handle, we can expect higher resistance at the medium-term 1.272 Fibonacci Extension level (drawn in orange) priced at $185.14, followed with more resistance at the bearish .786 Fibonacci Retracement level (drawn in blue) priced at $194.60.
If price action proceeds to climb above the 2017 low at $197.73 and the subsequent $200 handle, higher resistance can be located at the long-term bearish .886 Fibonacci Retracement level (drawn in blue) priced at $208.78.
What if the Sellers Regroup?
Alternatively, if the sellers step back into the market and push price action back below $150, we can expect immediate support below located at the short-term bearish .618 and .5 Fibonacci Retracement levels (drawn in red), priced at $142.63 and $135 respectively.
If ETH/USD goes beneath $130, more support can be found at the short-term bearish .382 Fibonacci Retracement level (drawn in red) priced at $127.36.
ETH/BTC Price
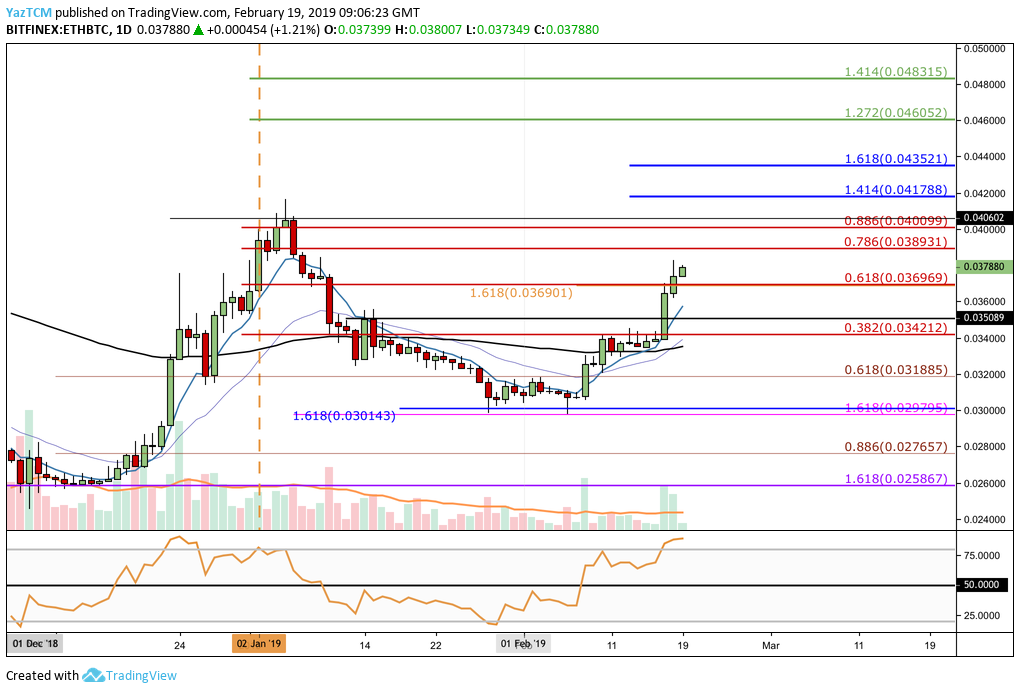
Analysing the daily ETH/BTC chart from above, we can see that Ethereum continues to make ground against Bitcoin.
The market has surged past resistance at the bearish .618 Fibonacci Retracement level (drawn in red) priced at 0.03696 BTC and is quickly approaching the 0.040 BTC level.
Trend: Bullish
The trend for ETH/BTC is also strongly bullish at this moment in time. We would need to see a break below the 0.033 BTC level to consider this market bearish.
Where is the Market Likely to Head Towards Next?
If the bullish momentum continues, we can expect initial resistance to be located at the bearish .786 and .886 Fibonacci Retracement levels (drawn in red) priced at 0.03893 BTC and 0.040 BTC, respectively.
If the buyers cause ETH/BTC to climb above the 0.041 BTC level, there is higher resistance located at the short-term 1.414 and 1.618 Fibonacci Extension levels (drawn in blue), priced at 0.04178 BTC and 0.04352 BTC respectively.
Further higher resistance above the 0.045 BTC level can then be expected at the medium-term 1.272 and 1.414 FIbonacci Extension levels (drawn in green), priced at 0.04605 BTC and 0.04831 BTC respectively.
What if the Sellers Regroup?
Alternatively, if the sellers step back into the market and drive price action lower, we can expect immediate support beneath to be located at the short-term bearish .618 and .382 Fibonacci Retracement levels, priced at 0.03696 BTC and 0.03421 BTC respectively.
Further support beneath this level can then be expected at the 0.03188 BTC and 0.030143 BTC levels.
Conclusion
The Ethereum rocket still has much room to travel higher if the bullish momentum will allow it to. This will be true especially if we see Ethereum continue to make further gains against Bitcoin.
If the market can break above the $167 handle in the coming days, we could see ETH/USD to continue to climb higher as it approaches the $200 level once again.