The past 24 hours of trading have seen a major surge in the cryptocurrency market after Bitcoin spikes above the $5000 level. One particular market that is enjoying the benefits of the recent cryptocurrency surge is Ethereum.
Ethereum has increased by an impressive 11% over the past 24 hours of trading, bringing the current trading price up to around $170. The market has now seen a 20% rise over the past 7 trading days with a further 31% price hike over the past month.
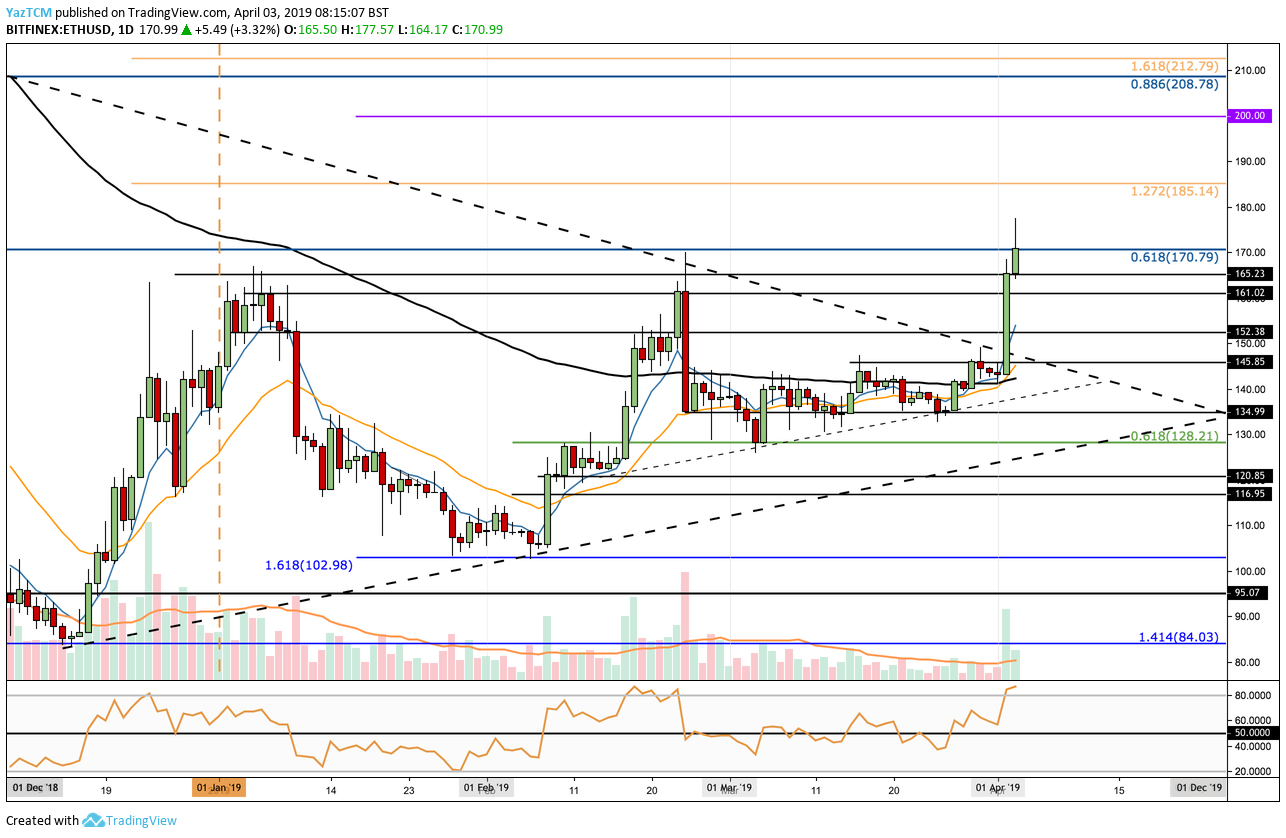
The recent price increase has caused ETH/USD to break above a long term symmetrical triangle pattern that the market has been trading within for over 4 months. The breakout has now allowed the market to climb above the $150 handle as it now makes the run toward $200.
Etheruem continues to hold the number 2 ranked position as it presently holds a $17.58 billion market cap valuation.
Let us take a look at the ETH/USD market and highlight some areas of resistance for the bulls before being able to reach the $200 level.
Ethereum Price Analysis
ETH/USD – SHORT TERM – DAILY CHART

What Has Been Going On?
Taking a look at the ETH/USD chart above we can clearly see the breakout of the symmetrical triangle pattern occurring during the most recent trading sessions. During March 2019, the market was stuck in a sideways trading condition as the cryptocurrency battled with the 100 day moving average and struggled to break above the $145 level.
The recent price surge allowed ETH/USD to break away from this sideways motion as the market climbed above resistance at the upper boundary of the triangle and continued higher into resistance provided by the bearish .618 Fibonacci Retracement level priced at $170.79. This bearish FIbonacci Retracement level is measured from the November 2018 high to the December 2018 low.
Ethereum has also created a fresh 2019 high at the $177.57 level.
What Is The Short Term Trend For ETH/USD?
The current short term trend is most certainly bullish for ETH/USD. For this market to be considered bearish we would need to see ETH/USD drop and fall beneath $135.
Where Is The Resistance On The Way Up To $200?
Ethereum must rise by a total of 18% from today’s price to reach the $200 level.
IF the bullish pressure continues to cause Ethereum to rise above the current resistance at $170.79, we can expect immediate higher resistance to be located at the $180 level. Above this, more resistance then lies at a medium termed 1.272 Fibonacci Extension level priced at $185.14.
If the buyers can continue to break above $190 they will then be clear to make an attempt at the $200 level.
Above $200 resistance lies at $208 and $212.
What If The Sellers Regain Control?
Alternatively, if the sellers regroup and start to push ETH/USD lower, we can expect immediate support below at $165 and $161. Beneath $160 we can then expect some support at $152 and $146.
What Are The Technical Indicators Showing?
The RSI has reached overbought conditions which is a signal that the bulls are in complete control of the market momentum. However, the recent rise into overbought conditions may also signal that the market may need to pull back slightly before it is able to climb further higher toward $200.
Conclusion
Ethereum has seen some massive growth over the past few days after breaking above the long term symmetrical triangle pattern. If the market can continue to break above $170 and $185 we can expect Ethereum to reach the $200 target within the next few days.

