
- Ethereum has dropped by almost 10% over the past 24 hours of trading.
- Trading will become volatile during the run up to the hard fork expected around January 16.
- Support moving forward: $124.91, $120, $115.15, $101.27, $93.00, $84.00
- Resistance moving forward: $134.67, $138.29, $146.74, $155.12, $171.94, $180.67, $190.83.
Latest Ethereum News
The Ethereum market has taken a beating over the past 24 hours, a result of Bitcoin breaking below the $4,000 handle and landing at the $3,700 region. During the price decline, Ethereum lost its second position to Ripple, once again, to fall into the 3rd position in the market cap rankings.
This market plummet comes days before the Constantinople hard fork, scheduled for block 7,080,000, estimated around January 16.
The hard fork will implement 5 Ethereum Improvement Protocols (EIPs) which will help Ethereum migrate from an energy-intensive PoW algorithm to a more eco-friendly PoS algorithm. To find out more about each of the EIPs to be implemented with the hard fork, take a look at this article.
One of the EIPs involved in the hard fork is EIP 1234 which proposes for the block reward to be reduced from 3 ETH per block to 2 ETH per block. The block reward is an incentive for miners to secure the network as they receive this reward each time a block is found within the Ethereum network.
However, an adjustment to the block award may reduce profits for miners which in turn may cause them to leave the network in the search for a higher ROI in their mining. A reduction from 3 ETH to 2 ETH is a 33% reduction which has led to many to dub this as the “thirdening.”
This isn’t the first time the block reward has been reduced. During the Byzantium hard fork, the block reward was reduced from 5 ETH to 3 ETH. The reduction in block reward is important as it helps to curb the rate of inflation that the Ethereum network will experience.
As of today, on average, there are around 20,300 ETH added to the circulating supply every day. After the Constantinople hard fork, this will be reduced to 13,400 ETH added daily to the supply.
Let us continue to take a look at price action for ETH/USD over the short term and highlight any potential areas of support and resistance moving forward.
ETH Price Analysis
Ethereum has seen a sharp 9.37% price decline over the past 24 hours of trading, bringing the current trading price down to $131.40, at the time of writing. The cryptocurrency has seen a further 15.22% price fall over the past 7 trading days but is still up by a significant 46% over the past trading month.
Ethereum is ranked in 3rd position as it presently holds a $13.55 billion market cap value, a small $200 million away behind second place Ripple.
The cryptocurrency has seen a 34% price decline over the past 90 trading days as the 41-month old project now trades at a value that is 90% lower than the all-time high price.
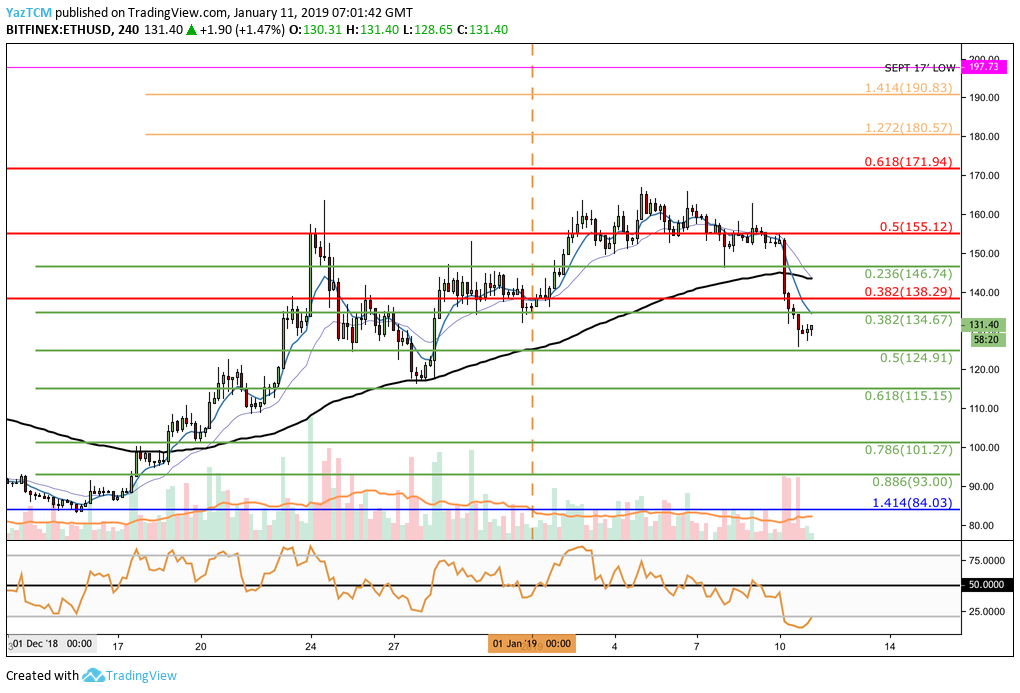
Taking a look at the 4-hour chart above, we can see that Ethereum had started the year off on a good note, rising to a high of around $167 during the first week of January 2019. However, the market was unable to penetrate above this level and has fallen significantly over the past trading day.
Price action has now dropped to a level just above our outlined short-term .5 Fibonacci Retracement level (drawn in green) priced at $124.91. Price action does look like it could attempt a move higher from this location now.
Trend: Bearish Below the Support at $124
If the market continues to head further lower and breaks below the $124 handle, we can consider the condition to be bearish.
At this moment in time, the trend is neutral. Although price has dropped significantly over the past 24 hours, it is still yet to create a lower low to confirm a bearish trend.
Where is the Support for ETH Below the Market?
If the sellers continue with their momentum and drive price action lower, we can expect immediate support towards the downside to be located at the short-term .5 Fibonacci Retracement level (drawn in green) priced at $124.91.
If the bears continue to drive price action even further lower, more support towards the downside can then be located at the short-term .618 and .786 Fibonacci Retracement levels (drawn in green), priced at $115.15 and $101.27.
If the selling continues and ETH/USD breaks below the $100 handle, expect further support beneath to be located at the short-term .886 FIbonacci Retracement level (drawn in green) priced at $93.00. This is closely followed by the previous downside 1.414 Fibonacci Extension level (drawn in blue) priced at $84.03.
Where Will ETH/USD Meet Resistance Towards the Upside?
If the bulls can regroup and begin to push price action higher for ETH/USD, we can expect immediate resistance above to be located at the short-term .382 and .236 Fibonacci Retracement levels (drawn in green), priced at $134.67 and $146.74 respectively.
Further resistance above the $150 handle can be expected at the bearish .5 and .618 FIbonacci Retracement levels (drawn in red), priced at $155.12 and $171.94 respectively.
If the buyers continue to drive price action even higher, they will encounter more resistance towards the upside at the short-term 1.272 and 1.414 Fibonacci Extension levels (drawn in orange), priced at $180.57 and $190.93 respectively. This is closely followed by more resistance at the September 2017 low priced at $197.73.
Conclusion
There tends to be uncertainty around hard forks in cryptocurrencies so we can expect the market to become very volatile during the run up to the fork.
The Constantinople fork will hopefully allow Ethereum to reach new heights with higher efficiency levels and a faster transaction per second rate. The “thirdening” is also an important aspect of the hard fork as it will help curb the rate of inflation within the Ethereum market.