
An analyst who goes by the pseudonym of “ScienceGuy9489” on Twitter has recently come out with a series of predictions for cryptocurrencies moving forward in 2019. In the series of predictions he had estimated that BTC would hit $28,000, LTC would hit $650, and Ripple would hit $4.
He had also made a prediction price for Ethereum in which he estimated that it has the potential to reach a high of $2,090. He had calculated this figure by taking the support at $80 from the 2018 high at $1,420 ($1420 – $80 = $1340). He went on to divide the result by 2 and then added this figure to the 2018 high to reach $2,090.
However, ScienceGuy9489 took things further by posting his technical chart which had shown a predicted breakout date for Ethereum on April 24, 2019.
ETH should be breaking out by April 24th pic.twitter.com/z8lwk9zMHY
— ScienceGuy9489 (@ScienceGuy9489) March 11, 2019
We can see a long term falling trend line extending from the 2018 high which also correlates with the 200-day moving average. A support area has also been highlighted at the $80 handle which creates a long term descending triangle for Ethereum.
ScienceGuy9489 highlighted a smaller termed triangle (in green) which covers trading during 2019. Where these two triangles meet up is where he expects the breakout to occur. This has been identified for April 24, 2019.
He also highlighted a rising channel on the RSI which should help the breakout to occur, so long as the RSI can remain above the 50 level as the breakout date approaches.
This is not the first time that ScienceGuy9489 made a breakout prediction for the Ethereum market. During May 2017, the analyst had predicted a break out for Ethereum on May 24, 2017. The analysis proved to be pretty accurate. However, the market did not break out on May 24, 2017 as predicted, but occurred a couple of days after.
Let us take a look at our own analysis and highlight some potential areas of support and resistance moving forward.
Ethereum Price Analysis
ETH/USD – MEDIUM TERM – DAILY CHART
What Has Been Going On?
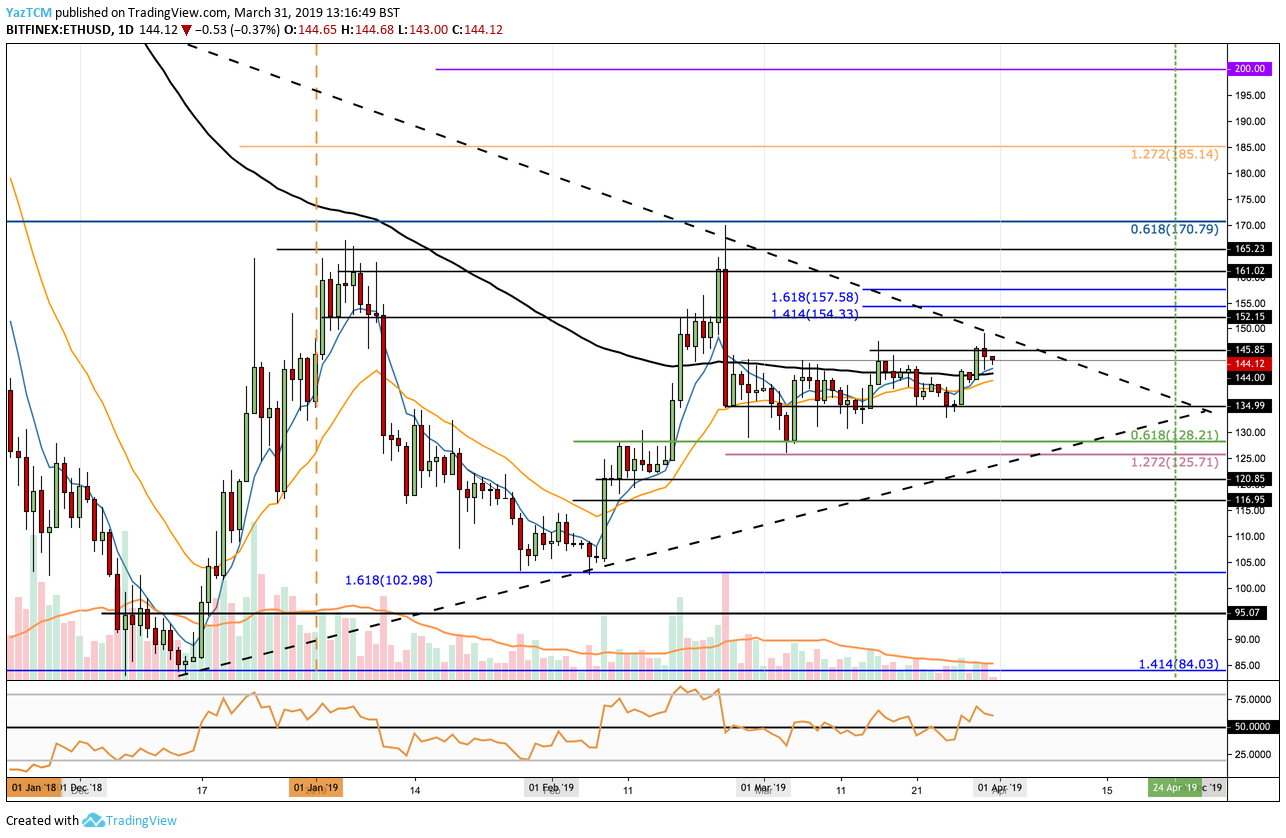
Taking a look at the daily chart above we can see that the market has been trading within a medium termed symmetrical triangle (different to ScienceGuy9489’s analysis). The upper boundary extends from the October 2018 high and the lower boundary extends from the December 2018 low.
During March 2019 we can see that the market has been struggling to break above the $145 handle as the cryptocurrency has been battling to break above the 100 day moving average for the entire month. We can see price action is now above the 100 day moving average but has still yet to break above $145.
Is The April 24 Prediction Possible?
We can expect the market to continue to trade within the confines of the symmetrical triangle until a breakout occurs. We can see that the apex of the triangle is very close to April 24, 2019, which is the same breakout date that ScienceGuy9489 predicted. However, there is nothing stopping the market from breaking out above before the expected date.
Where Is The Resistance Above The Triangle?
If the market breaks above the triangle we can expect immediate higher resistance to be located at $152, $161 and $165. The resistance at $165 is considered strong as the market has not been able to close above this level during all of 2019.
Above $165 we can expect more resistance at $170, $185, and $200.
What If The Bears Take Control?
Alternatively, if the sellers regain control and start to push the market lower, we can expect immediate support to be located at $135. Beneath this we can expect more support at the short term .618 Fibonacci Retracement level (drawn in green) priced at $128. This area of support will also be bolstered by the lower boundary of the symmetrical triangle.
IF the bearish pressure causes ETH/USD to break beneath the triangle, we can expect support at $125, $120 and $116.
What Are The Technical Indicators Showing?
The RSI has recently broken above the 50 level which suggests that the bulls have started to take control of the market momentum. We can expect a breakout above the triangle during April 2019 so long as the RSI can remain above the 50 level and continue to rise further higher.