
- Decentraland is currently undergoing its latest LAND auction to sell off the remaining plots of unowned digital land.
- The market is trading around the $0.052 handle, with strong support beneath at $0.050.
- Support moving forward: $0.050, $0.04826, $0.045, $0.04343, $0.03961, $0.03519, $0.03022.
- Resistance moving forward: $0.060, $0.06366 $0.072, $0.07315, $0.08083, $0.08850, $0.09942.
Latest Decentraland News
The MANA LAND auctions are fully underway and will continue until December 23, 2018. This is now your opportunity to purchase previously unsold and unowned LAND within the Decentraland Genesis City.
Decentraland’s LAND Auction has started! As of right now, through December 23rd, the remaining unowned LAND in Genesis City is up for grabs. Get started at https://t.co/9Qcc0jbgmx, or learn more on our blog: https://t.co/FLoFq5s1d2 pic.twitter.com/0r3GQz7nEH
— Decentraland (@decentraland) December 10, 2018
Decentraland is a virtual reality platform built on the Ethereum blockchain. It allows you to buy and sell land within the city, which can then be later developed upon to monetize as users travel through the city.
In the last land auction, over 20,000 plots of LAND were sold before the auction ended. In the current LAND auction, there are over 9,000 remaining unsold plots of LAND up for grabs.
The MANA team has elected to go for a Dutch-style auction for the LAND. The plots begin at a price of 200,000 MANA and are gradually reduced in price each day until they have been purchased, or until the auction ends.
Interested parties can use a plethora of ERC-20 tokens to purchase LAND in this auction such as MKR, BNB, ZIL and ELF. The MANA received from the auction is burned, effectively removing them from circulation.
In other MANA news, the cryptocurrency has also recently been added to the Coinbase Pro platform, granting users the opportunity to purchase MANA through the well-known exchange.
Let us continue to take a look at the MANA/USD market and provide some potential areas of support and resistance to watch out for.
MANA Price Analysis
MANA has seen a small price decline totaling 1.22% over the past 24 hours of trading, bringing the current price of each token to around $0.05281, at the time of writing.
The cryptocurrency has seen a 8.30% price reduction over the past week of trading and a further precipitous 49.99% price collapse over the past 30 trading days.
The 15-month old project is now ranked in 65th position in terms of market cap rankings and holds a total market cap value of $55.18 million.
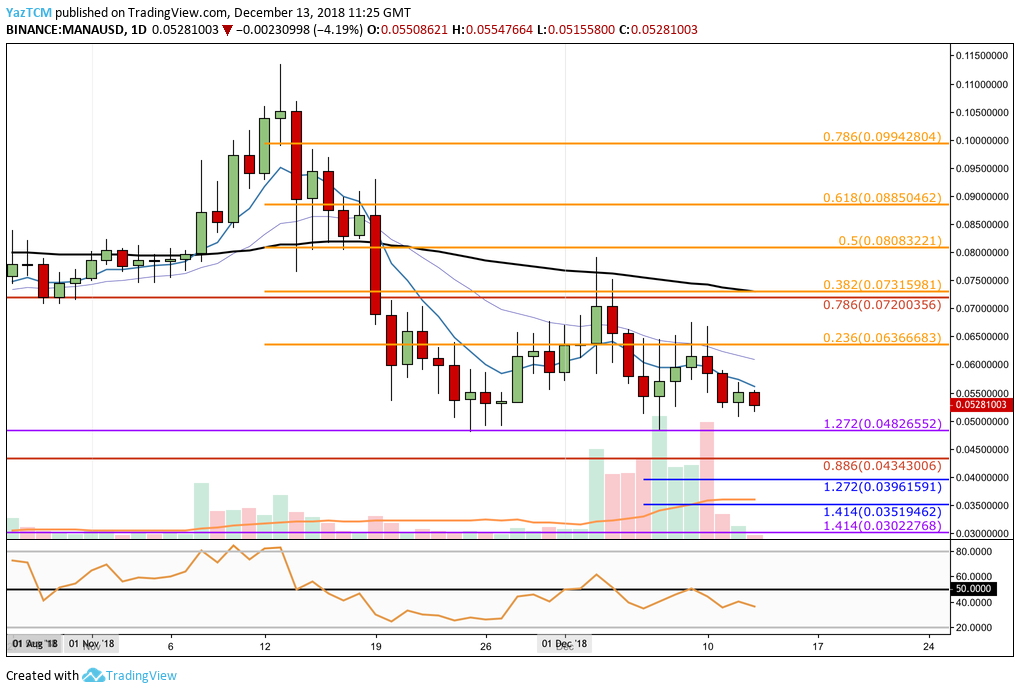
Looking at the short-term price chart above, we can see that MANA had found support during the November 2018 price collapse at a long-term downside 1.272 FIbonacci Extension level (drawn in purple) priced at $0.04826, before rebounding.
The market has held its value relatively well during December 2018 as price action has not yet made a fresh low since the rebound.
Trend: Neutral But Bearish If MANA Breaks Below $0.0482
As the market has been trading sideways since rebounding from the aforementioned support we can assume that the market is now in a neutral trading condition.
,If the sellers ramp up the pressure and push price action below the support at $0.048 this will create a fresh low and resume the bearish market condition it was previously trading within.
Where is the Support for MANA Below $0.048?
If the sellers do indeed manage to push price action below the support, firstly at $0.050 and then $0.048, we can expect price action to continue lower until reaching support at the long-term .886 Fibonacci Retracement level (drawn in red) priced at $0.04343.
Further support below this can be expected at the short-term downside 1.272 and 1.414 Fibonacci Extension levels (drawn in blue), priced at $0.03691 and $0.03519 respectively.
What If the Bulls Take Control of the MANA Market?
If the buyers step into the market and begin to drive the price action higher for MANA/USD, we can expect immediate significant resistance above to be located at the psychological round number handle at $0.06.
If the bullish pressure continues to cause MANA/USD to climb above $0.06, further higher resistance can be located at the bearish .236 and .382 Fibonacci Retracement levels (drawn in orange), priced at $0.06366 and $0.07315.
Further resistance toward the upside can then be located at the bearish .5 and .618 FIbonacci Retracement levels (drawn in orange), priced at $0.08083 and $0.08850 respectively.
What Are the Technical Indicators Showing?
At the start of the month, the RSI had managed to break above the 50 handle as the bulls took control of the momentum within the market.
However, this was extremely short0lived as the RSI penetrated back beneath the 50 handle to signal that the sellers are back in control of the momentum.
The RSI looks to be heading further lower which could be a sign that there is still more selling pressure to come.
Conclusion
For those interested in purchasing LAND in the Decentraland economy, now is one of the best opportunities to purchase the valuable digital asset at market rate.
Price action for MANA has remained relatively stable in December 2018 so far but this will all change if the sellers push price action below $0.048, which is the next crucial level to watch out for.