The cryptocurrency market has experienced a rough few trading sessions after the market bloodbath on November 14, 2018 which saw Bitcoin plunge below the $6,000 handle.
The total market cap value for the entire industry came in at $210 billion on November 14, but had collapsed to a low of $174 billion on November 15, 2018. The bulls are clambering to regain some of the losses as the market cap currently stands at $184 billion, at the time of writing.
The graph below presents an overview of the extent of the market cap wipeout.

During the turbulence, many of the top altcoins remained relatively stable in their market pairings against Bitcoin, and thus were able to mute the already increased USD losses caused by the Bitcoin drop.
The majority of the top 30 cryptocurrencies are now managing to recover some of their losses incurred over the market wipeout as most are positive against Bitcoin today, November 16.
Ripple (+2.98%) and Stellar Lumens (+5.63%) are both enjoying small positive gains against Bitcoin. 0x (+10%) and BAT (+12%), both recently added by Coinbase, have been printing the highest gains against Bitcoin in the top 30.
Bitcoin Cash has posted a strong negative loss relative to Bitcoin amounting to 7% as the cryptocurrency now trades at around the $415 handle with a 5% drop against the USD.
Bitcoin: Is BTC/USD Heading Toward $6,000 or $5,300 next?
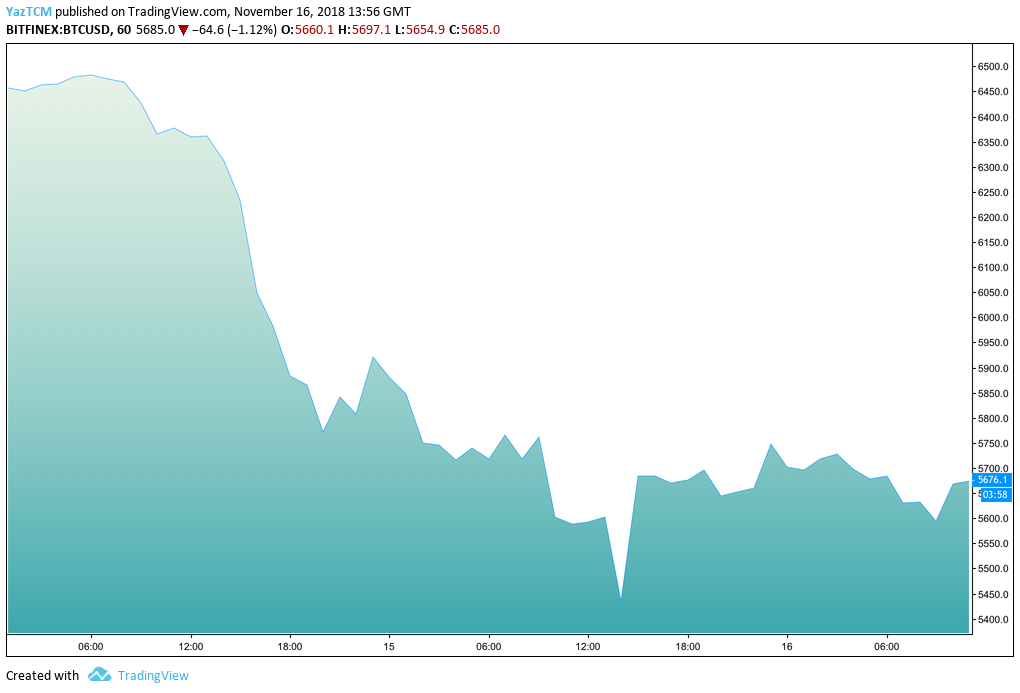
Bitcoin has seen a small 2.29% price increase over the past 24 hours of trading as the market trades around the $5,676 handle. The buyers are trying to prevent the market from dropping further lower as they begin the long journey back to the $6,000 handle.
The market plunge saw Bitcoin reach a low of $5,432 on November 15, 2018, a price not seen since November 12, 2017 when Bitcoin had hit a low of $5,400. The price drop also saw Bitcoin’s market cap drop below the $100 billion handle. It currently holds a $97 billion market cap value.
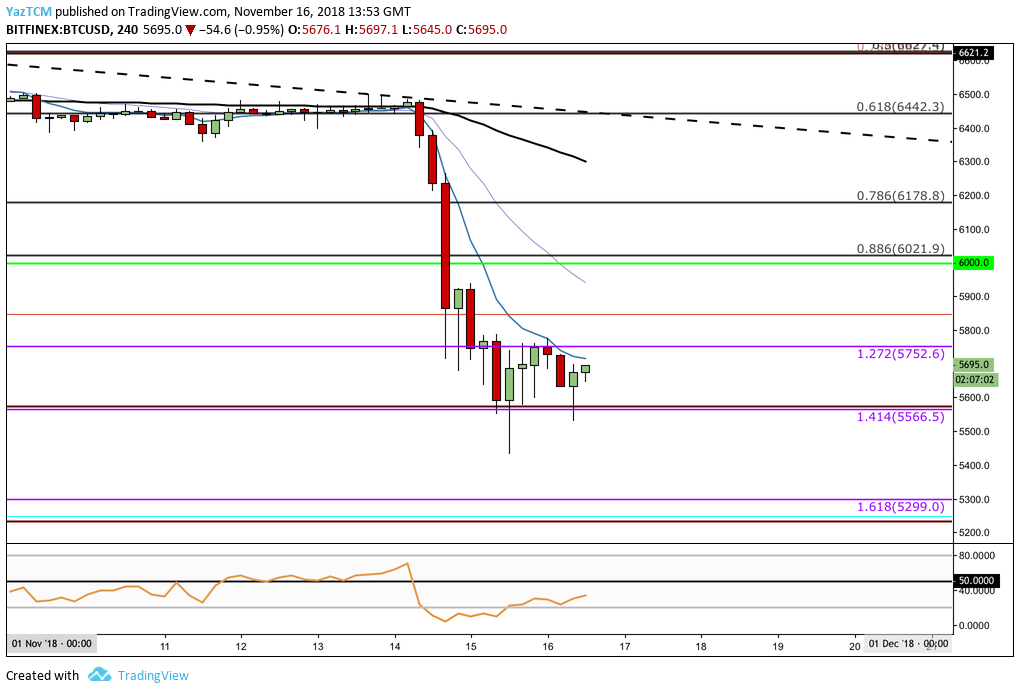
BTC/USD – SHORT TERM – DAILY CHART
We can see that BTC/USD is trading at the support highlighted in our Bitcoin price analysis article. The market has found a form of support at the downside 1.414 Fibonacci Extension level (drawn in purple) priced at $5,566.
If the sellers break below this support level, the market could be heading further lower toward the 1.618 Fibonacci Extension level priced at $5,299 and then eventually toward the $5,000 handle.
For further guidance, we recommend taking a look at the support and resistance levels in our Bitcoin price analysis article.
Ripple: XRP/USD On a Journey Back Towards $0.50
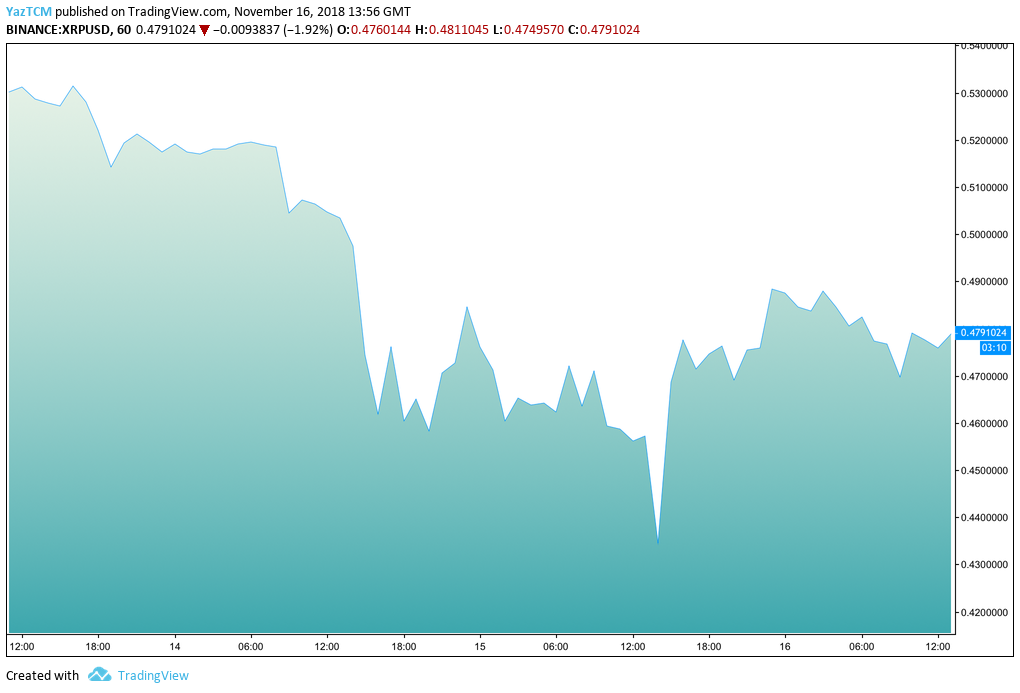
Ripple has seen a 24-hour price increase amounting to 5.48% as the cryptocurrency trades around the $0.4791 handle, at the time of writing. The market nosedive saw XRP/USD fall from a high of $0.5207 on November 14, 2018 to a low of $0.4318 on November 15, 2018.
Price action has since rebounded as the bulls make their way back toward the $0.50 handle once again. The market turbulence led Ripple to overtake Ethereum for the number 2 position in market cap rankings. Ripple currently holds a $19.08 billion market cap value, after the market has seen a strong 90-day trading period where price action increased by 43%.
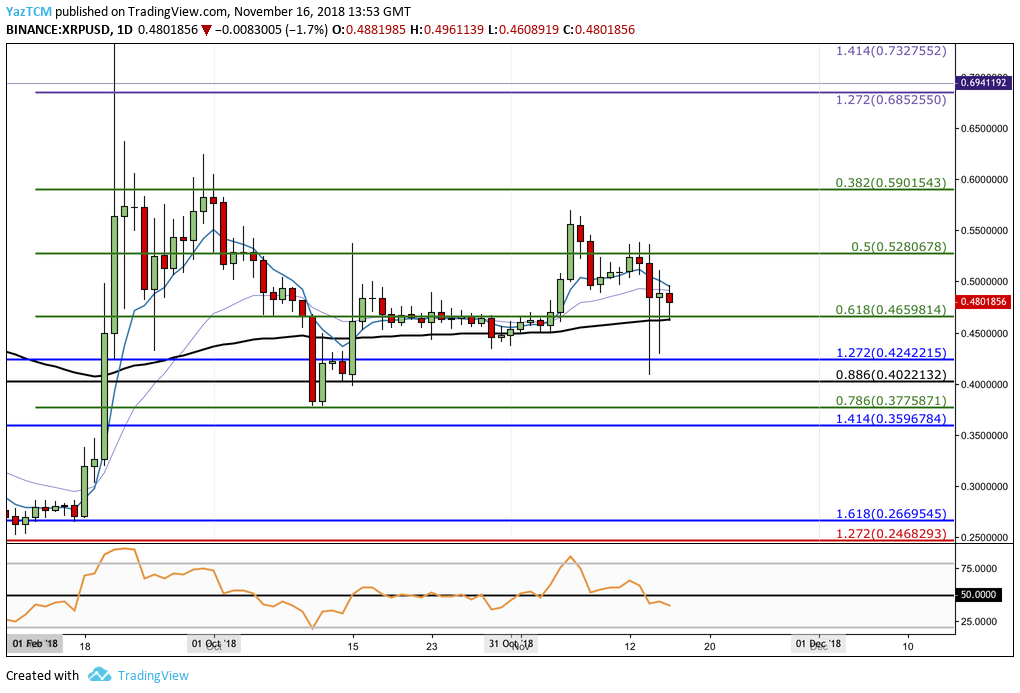
XRP/USD – SHORT TERM – DAILY CHART
XRP/USD has remained relatively stable since our last XRP analysis. During the remainder of October 2018, the market traded along the support provided by the .618 Fibonacci Retracement level priced at $0.4659.
We can see that this level of support was vital during the market price decline over the past few trading sessions. Price action has managed to close each session above the support level.
Moving forward, if the bears break below the $0.46 support level, we can expect further support below at the $0.42 and $0.40 levels. On the other hand, if the buyers can cause XRP/USD to climb above the $0.50, they will meet further higher resistance at the $0.52 and $0.59 handles.
For further analysis, we recommend taking a look at our previous article as the support and resistance levels are still mainly in play.
Ethereum: Will Ethereum Hold Above $180?
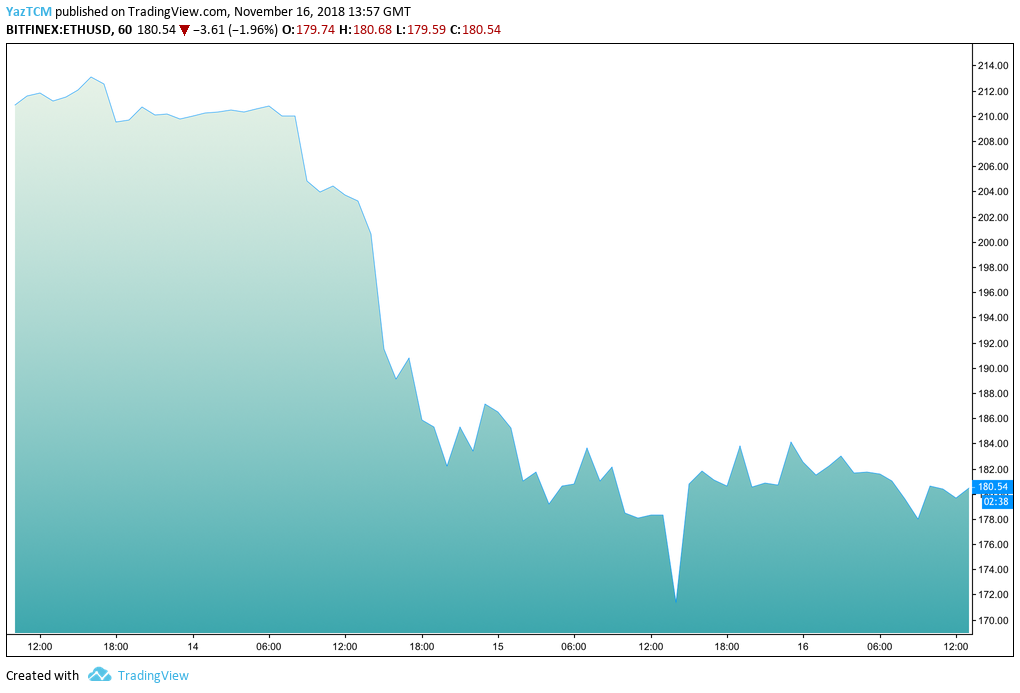
Ethereum has seen a small price rebound amounting to 2.19% over the past 24-hour trading period as the cryptocurrency is presently trading at the $180 support handle. Ethereum had been trading at a high of $211.40 on November 14, 2018 before suffering the bearish sentiment and dropping to a low of $171.36 a day later on November 15, 2018.
The market has seen a 15% price decrease over the past 7 trading days and is now ranked 3rd after its market cap value fell to $18.37 billion.
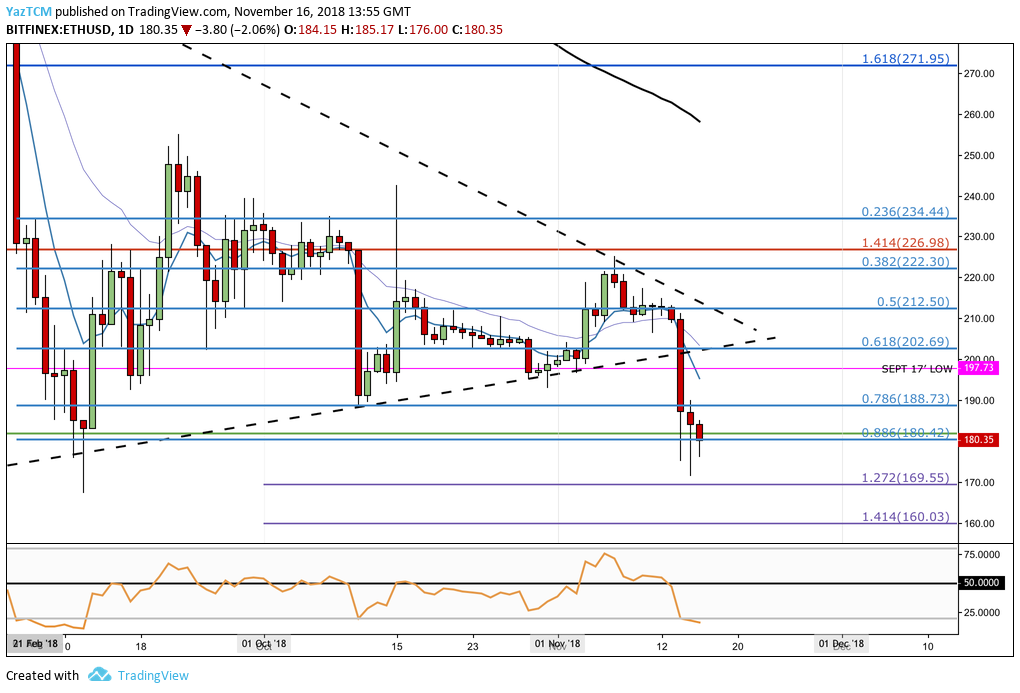
ETH/USD – SHORT TERM – DAILY CHART
The negative pressure has caused ETH/USD to drop out of our previously highlighted symmetrical triangle consolidation pattern mentioned in our previous ETH analysis. We can see that ETH/USD continued to fall until it found support at the .886 Fibonacci Retracement level (drawn in blue) priced at $180.42.
If the sellers continue to ramp up their aggression to push the market below $180, we can expect further support below at the $169.55 and $160.03 handles. Alternatively, if the bulls can regroup and begin their ascent, they will meet resistance at $188 and $197 before reaching $200.
You can revisit our last Ethereum article to see the support and resistance levels that are still in action today.


