It appears as if the bulls may be back in town as, over the past 24 hours of trading, Cardano has seen a massive 10% surge which has allowed the cryptocurrency to climb higher toward the $0.080 level. Cardano is currently trading at a value of around $0.078 after seeing a further significant 81% increase in price over the past 90 trading days. The market has pulled back slightly from the 10% increase and now shows an 8.22% price rise on CoinMarketCap.
The price surge occurred a couple of days after Charles Hoskinson, CEO of IOHK, announced a huge partnership with the Ethiopian government via a YouTube AMA on April 21, 2019.
In the video, Hoskinson states that a Memorandum of Understanding (MoU) has been signed with the Ethiopian government in order to set up a digital payment system in partnership with the Ethiopian Ministry of Innovation and Technology. The partnership will primarily allow Ethiopian citizens living in the capital, Addis Ababa, to conduct utility payments as well as pay for public transport with ADA.
Cardano is currently ranked in 10th position on the top cryptocurrency projects by market cap value, as it currently holds a market cap value of $2.07 billion. The cryptocurrency is fast approaching the 9th position, held by Stellar, as it sits a small $140 million behind the project.
Let us take a look at the Cardano market and highlight some potential areas of support and resistance moving forward.
Cardano Price Analysis
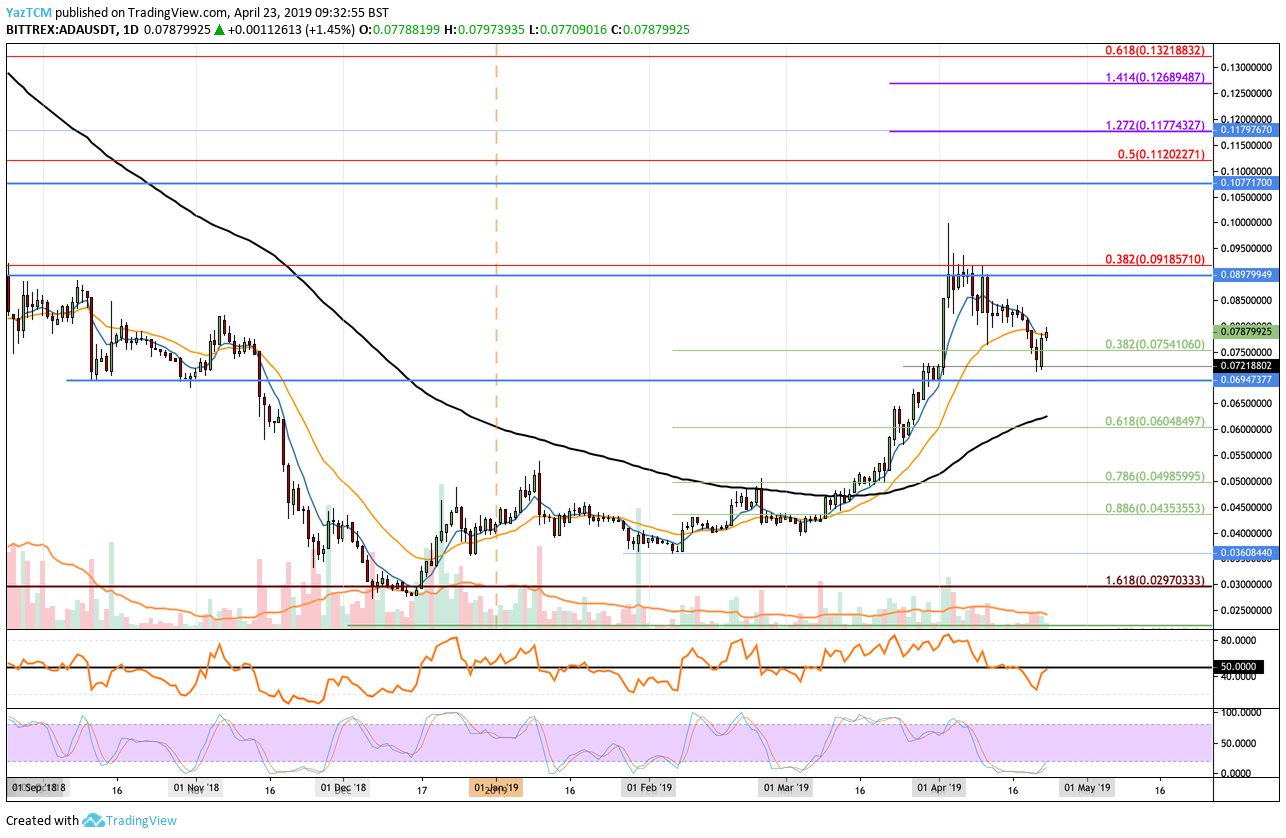
ADA/USD – MEDIUM TERM – DAILY CHART
What Has Been Going On?
Taking a look at the ADA/USD chart above, we can see that the market penetrated above the 100-day moving average during March 2019, and price action for Cardano has been soaring ever since.
After breaking above the 100-day moving average, ADA/USD went on to climb higher, breaking above the November 2018 high at $0.08199 and reaching resistance located at the bearish .382 Fibonacci Retracement level (drawn in red) priced at $0.09185 before rolling over. This long-term bearish Fibonacci Retracement level is measured from the July 2018 high to the December 2018 low.
After falling from the resistance at $0.09185, Cardano fell into support at $0.072 before bouncing higher again. ADA/USD is currently trading at a price of $0.078 as it attempts to break above the 21-day EMA.
What Is the Current Short-Term Trend?
After the recent rebound at $0.09185, the current trend remains bullish in the short term. For this bullish trend to continue, we would need to see ADA/USD break above the resistance at the $0.09185 resistance level.
If ADA/USD was to drop below $0.07, we can consider the short-term bullish trend to be invalidated.
Where Can We Go From Here?
If the bullish momentum persists and pushes ADA/USD higher, we can expect immediate significant resistance above to be located at the bearish .382 Fibonacci Retracement level (drawn in red), priced at $0.09185.
If the bulls can continue above this level of resistance, we can expect further higher resistance to then be located at the $0.1 resistance level. Above $0.1, more resistance then lies at $0.107 and then at the bearish .5 Fibonacci Retracement level (drawn in red) priced at $0.1120.
Above $0.1120, higher resistance then lies at the 1.272 and 1.414 Fibonacci Extension levels (drawn in purple), priced at $0.1177 and $0.1268, respectively. Above this, the last level of resistance to highlight lies at the bearish .618 Fibonacci Retracement level (drawn in red) priced at $0.1321.
What If the Sellers Step Back In?
Alternatively, if the sellers regroup and start to push the market lower, we can expect immediate support toward the downside to be located at the $0.07218 level. Support beneath this then lies at $0.070, followed with more support at $0.06947.
If the sellers continue to drop the market beneath $0.065, we can expect strong support below to be located at the short-term .618 Fibonacci Retracement level (drawn in green), priced at $0.060. This area of support is bolstered by the 100-day moving average which hovers slightly above this support.
What Are the Technical Indicators Showing?
The RSI has recently re-approached the 50 level as the bulls attempt to re-take the momentum within the market. However, the RSI must break above the 50 level if we expect the bulls to continue to drive ADA/USD higher.
The Stochastic RSI has recently produced a signal that suggests that the RSI will break above 50. The Stochastic RSI has recently initiated a crossover above in oversold conditions which indicates that the previous selling pressure has ended and that the bulls may be about to resume their control.