
Cardano has seen a month of falling prices during April 2019, with its cryptocurrency ADA falling by a total of 13.72% over the past 30 trading days. Cardano is now currently trading at a price of around $0.6865, sitting comfortably in the 10th place in the top-ranked cryptocurrency projects. Cardano currently holds a market cap value of $1.78 billion.
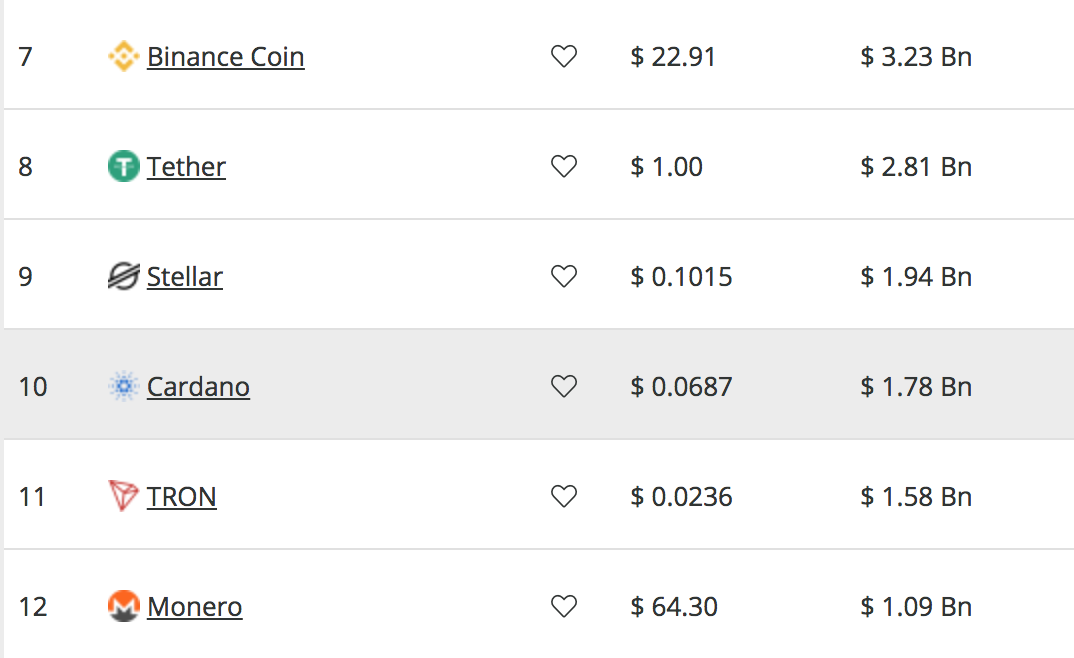
Despite recent price declines during April 2019, the market is still up by a total of 79% over the previous 90 trading days. The 14-month-old cryptocurrency project is now swiftly closing in on the 9th position, occupied by Stellar (XLM), which sits a mere $160 million away from Cardano’s market cap value.
In this article, we will take a look at Cardano’s potential to rise by 36% in May 2019 and hit the $0.094 target level. At the start of April, we wrote an article predicting that Cardano would hit $0.1 by the end of the month. With a little help from the Bitcoin price surge, Cardano came very close to hitting this target, reaching a high of $0.9985 on April 3.
Let us take a look at the ADA/USD market and highlight some areas of resistance for the bulls before it is able to reach the $0.094 level.
Cardano Price Analysis
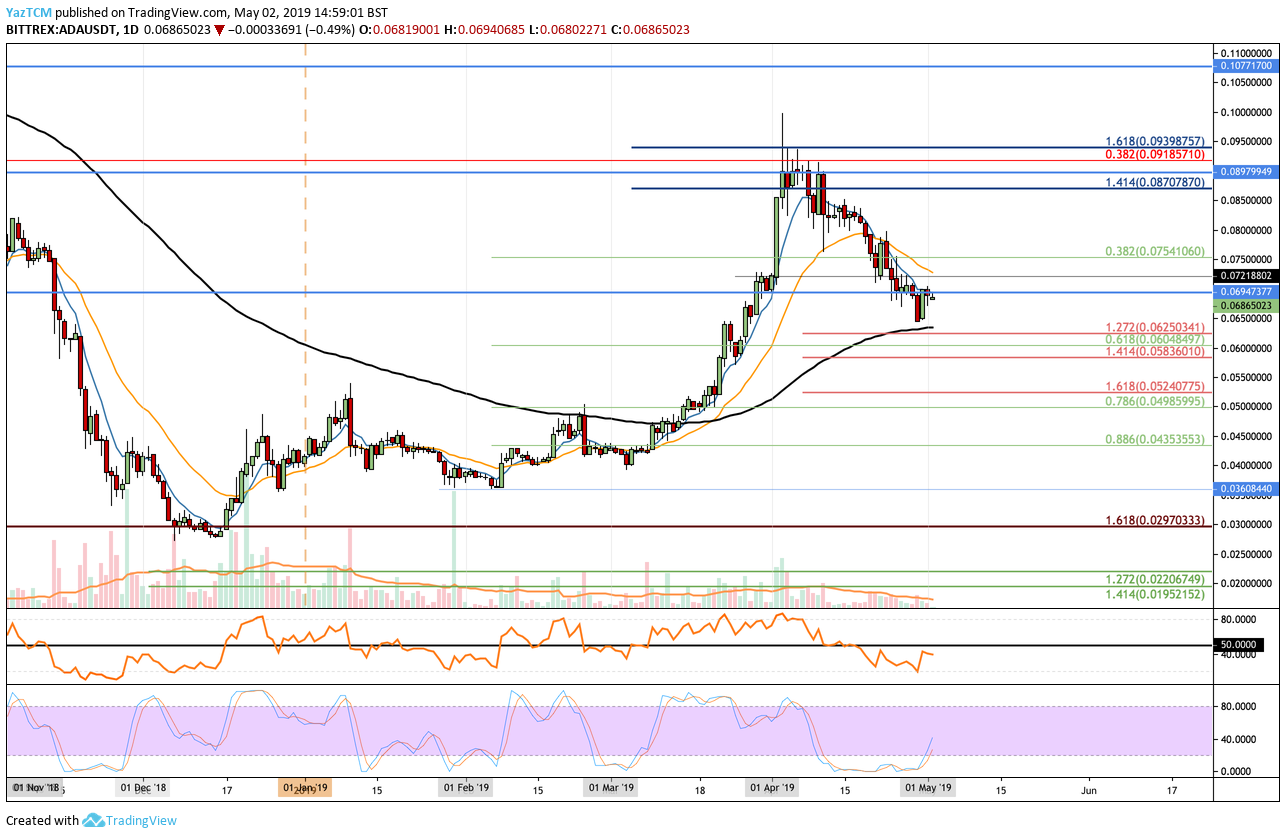
ADA/USD – SHORT TERM – DAILY CHART
What Has Been Going On?
After our previous Cardano price prediction, we can see that the market surged higher over the following few days, coming very close to the $0.1 target. However, we can see that there was strong resistance for Cardano at our highlighted level at the 1.618 Fibonacci Extension level (drawn in blue), priced at $0.09398.
Cardano went on to reverse after the market reached this resistance. Cardano then dropped into support around the $0.065 level, after dropping a significant 35% from high to low in April 2019.
What Is the Short-Term Trend For ADA/USD?
The market is now considered to be in a neutral trading condition after Cardano dropped beneath the $0.07 level. If price action continues to fall and break beneath the 100-day moving average around $0.63, we can then consider the market to be in a bearish trading condition.
Where Is the Resistance On the Way Up To $0.094?
If the buyers can band together and begin to drive the market above $0.070, we can expect immediate higher resistance to be located at $0.072 and $0.075. Above $0.075, we can expect more resistance to be located at $0.08, $0.085, and then at the previous 1.414 Fibonacci Extension level (drawn in blue), priced at $0.087.
If the buyers then continue to break above the resistance at $0.090, more resistance will then lie at $0.9185, and then at the 1.618 Fibonacci Extension level (drawn in blue), priced at $0.09398. If the bulls can clear this area, they will then be free to make a run at the $0.094 target level.
If the bullish drive continues to push ADA/USD above the $0.094 target level, we can expect more resistance above to be located at $0.095, $0.097 and $0.10.
What Are the Technical Indicators Showing?
During April 2019, the RSI traveled from an overbought condition all the way down into oversold territory. However, toward the end of the month, the RSI bounced higher and is now approaching the 50 level, which indicates that the sellers may be running out of steam.
Furthermore, the Stochastic RSI has recently signalled a crossover signal in oversold territory, which indicates that the bulls may be about to increase the buying pressure.
Conclusion
ADA/USD may still see a small price drop in the days to come. If this is the case, we can expect immediate support to be located around $0.063, where the 100-day moving average is located. However, if the buyers can continue to cause ADA/USD to break back above $0.070 and higher, we may very well see Cardano reaching the $0.094 price target during May 2019.