
Cardano has seen an impressive price increase over the past 30 days, which totals 58%. Furthermore, the cryptocurrency has seen a 76% price surge over the past 90 trading days, bringing the current price up to the $0.07 level.
This glorious price surge has largely been attributed to the release of Cardano’s 1.5 mainnet release and their recent addition to the Ledger Nano family.
Cardano has now stormed into the top 10 ranked cryptocurrencies, overtaking Tron and Bitcoin SV. The 18-month-old cryptocurrency now holds a $1.82 billion market cap valuation.
In this article, we will take a look at the potential for Cardano to rise by 43% in April 2019, and hit the $0.10 level. Cardano has not seen a price of $0.10 for over 7 months, as the last time the market was at this level was during early September 2018.
Let us take a look at the ADA/USD market and highlight some areas of resistance for the bulls before it is able to reach the $0.10 level.
Cardano Price Analysis
ADA/USD – SHORT TERM – DAILY CHART
What Has Been Going On?
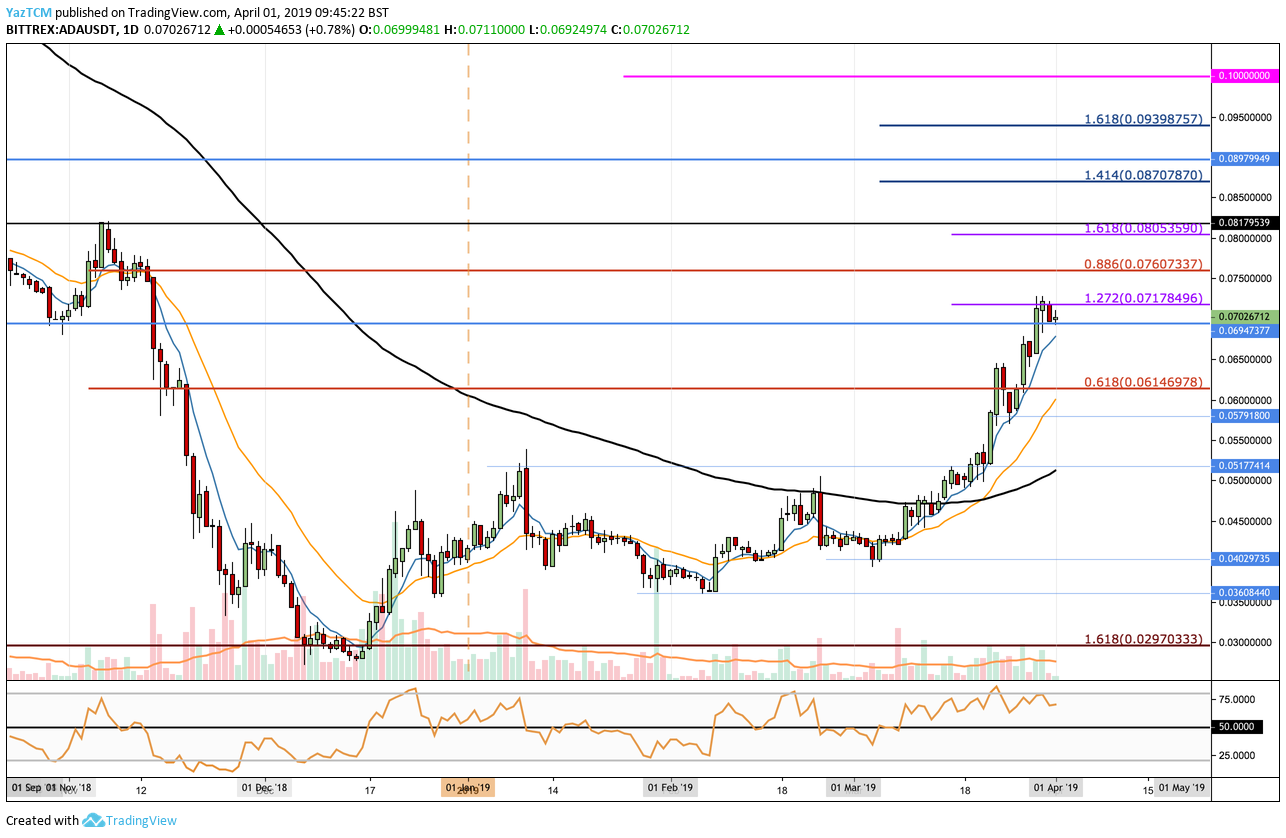
Cardano has had an impressive start to the year after a brief decline to the $0.036 level during January/February 2019. After rebounding from the $0.036 level, the market has continued to climb higher at an increasing pace.
Toward the start of March 2019, we can see that the market had managed to break above the 100-day moving average for the first time since May 2018. After breaking above that level, we can see that ADA/USD continued to rise until the market had reached resistance at a short-term 1.272 Fibonacci Extension level (drawn in purple) priced at $0.0717 recently.
Price action has fallen slightly and is now trading at support around the $0.070 level.
What Is the Short-Term Trend For ADA/USD?
Cardano is most certainly in a bullish trend at this moment in time. For this trend to be considered bearish, we would need to see ADA fall and make a lower low beneath the $0.057 level.
Where Is the Resistance On the Way Up to $0.10?
If the buyers manage to break the initial resistance at $0.0717 and climb higher, they will meet more resistance at the bearish .886 Fibonacci Retracement level (drawn in red), priced at $0.076. This bearish Fibonacci Retracement level is measured from the November 2018 high to the December 2018 low.
Above $0.076, higher resistance is then expected at the $0.080-$0.08179 price region. The resistance at $0.08179 is deemed significant, as it marks the November 2018 price high.
If the bullish momentum continued to cause ADA/USD to break above $0.082, we can expect further higher resistance to be located at the medium-termed 1.272 Fibonacci Extension level (drawn in dark blue), priced at $0.087. This is then followed with resistance at the $0.090 level.
Before being clear to re-test the $0.10 level, the bulls will first have to tackle resistance at the medium-termed 1.618 FIbonacci Extension level priced at $0.09398.
What Are the Technical Indicators Showing?
The RSI has been in bullish territory, above the 50 level, for the entire month of March 2019. The RSI has started to show some signs of divergence against price action, which could suggest that a possible “pull-back” is on the cards before the market can continue to climb higher.
Conclusion
Cardano’s recent price surge during February and March 2019 has been nothing short of impressive. According to the RSI, the market may be slightly overextended at this moment in time. However, after a slight pullback, perhaps toward the $0.061 region, we can expect Cardano to continue to rise higher.
A further 46% price increase during the month of April may be slightly difficult to achieve after the market has already surged by 58% over the past 30 days. However, if the bulls can maintain the RSI above the 50 level, there is still a strong change for ADA to reach $0.1 before the end of April.