
Cardano officially left the previously bearish market after rising 2x from the bottom and climbing above the $0.55 level during March 2019. Despite the 6.42% price drop over the past 30 trading days, Cardano has still seen a mega price increase, which totals over 100% throughout the past 90 trading days.
Cardano remains ranked 10th place in the top cryptocurrency projects by market cap value, as it presently holds a $2.18 billion market cap value.

In this article, we will take a look at the potential for Cardano to rise and reach the $0.1 level before the end of Q2 2019. There is still over 1 month and 1 week left in Q2 2019, and for Cardano to reach the $0.1 price target it will need to increase by a total of around 20% from today’s price level.
To be able to hit the $0.1 target, Cardano will also have to overcome significant resistance at the $0.09 and $0.094 levels.
Cardano has recently been praised by cryptocurrency rating agency Weiss Ratings for not only being one of the best projects in the space, but also having one of the cheapest coins out there.
#Cardano is one of the best projects in the space, and also one of the cheapest cryptos out there. #ADA #crypto #cryptocurrency #altcoins #bitcoin #BTC
— Weiss Ratings (@WeissRatings) May 20, 2019
Let us take a look at the Cardano market and highlight some potential areas of support and resistance moving forward.
Cardano Price Analysis
ADA/USD – MEDIUM TERM – DAILY CHART
What Has Been Going On?
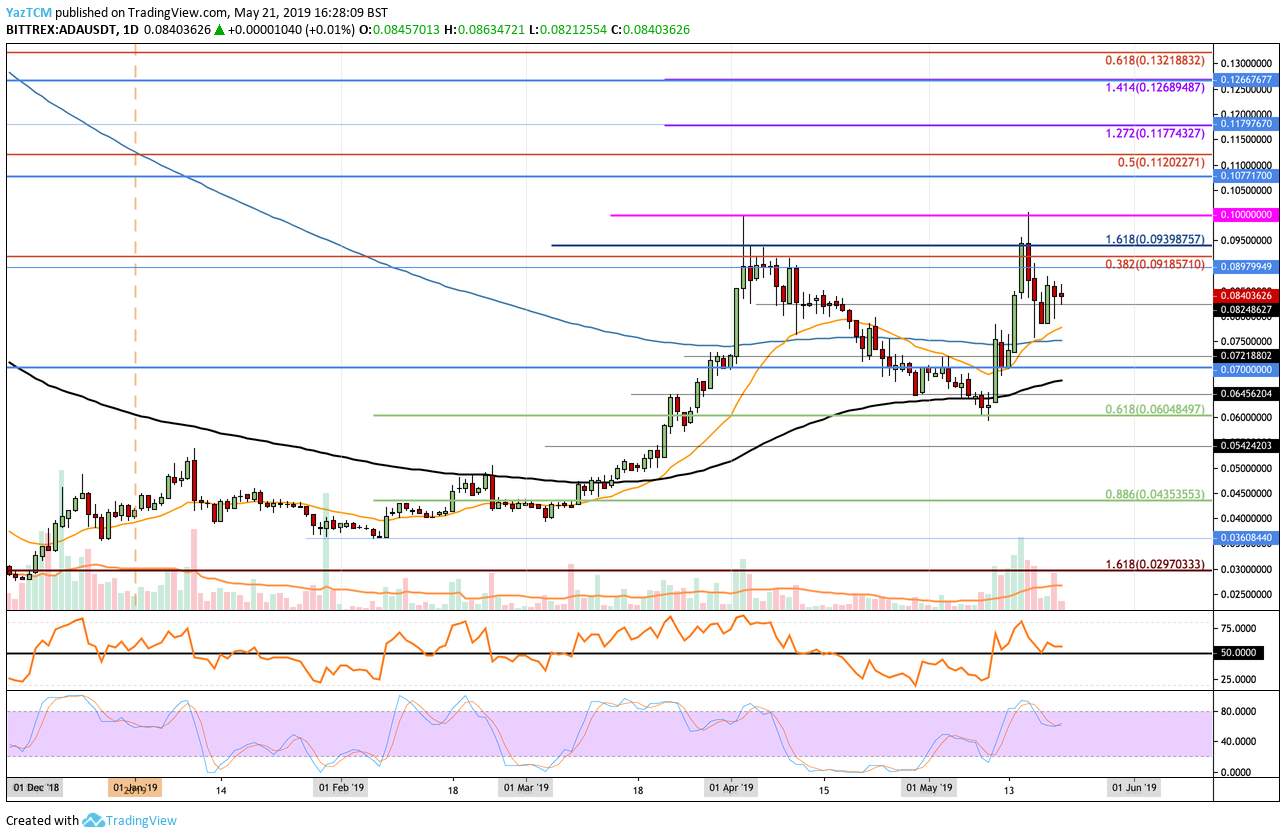
Taking a look at the ADA/USD chart above, we can see that the Cardano surge commenced during March 2019, when ADA managed to break above the 100-day moving average level. The bullish press continued further higher during early April 2019, after ADA/USD managed to reach a high of $0.1.
After reaching this high, we can see that the Cardano market proceeded to roll over and fall throughout the rest of April 2019. Durim the opening of May 2019, we can see that ADA/USD managed to find some support at the short-term .618 Fibonacci Retracement level (drawn in green), priced at $0.06048. This area of support was further bolstered by the 100-day moving average level, which is also currently hovering within this area.
The Cardano market went on to then rebound at this level of support and continued to climb higher back into resistance at the $0.1 level. More specifically, we can see that ADA/USD had found resistance at a 1.618 Fibonacci Extension level (drawn in blue), priced at $0.09398. Price action was unable to break above this resistance level both in April and May 2019.
What Is the Current Trend?
The current short-term trend is now considered to be neutral until price action can break and close above the $0.1 level. For this market to be considered as bearish we would need to see ADA/USD fall beneath the $0.06 support level.
As Cardano has increased by a total of 102% over the past 90 trading days, the long-term trend for Cardano can be presumed to be bullish.
Where Is the Resistance On the Way Toward $0.1?
If the bullish pressure re-ignites and pushes ADA/USD higher, we can expect immediate resistance above the market to be located at $0.090 and then at $0.09185. The resistance at $0.09185 is provided by a long-term bearish .382 Fibonacci Retracement level (drawn in red), measured from the July 2018 high to the December 2018 low.
Above this, further higher significant resistance is then located at the 1.618 Fibonacci Extension level (drawn in blue), priced at $0.09398. If the bulls continue to push above the $0.095 level, they will then be clear to make an attempt at the $0.1 target level.
Above $0.1, further higher resistance can then be expected at $0.107 and at the long-term bearish .5 Fibonacci Retracement level (drawn in red), priced at $0.1120. Beyond $0.1120, we can expect more resistance at the short-term 1.272 and 1.414 Fibonacci Extension levels (drawn in purple), priced at $0.1177 and $0.1268.
Where Is the Support Beneath the Market?
Alternatively, if the sellers regroup and push the market lower, we can expect immediate support beneath the market to be located at $0.08 and $0.075 (which also contains the 200-day moving average level). Beneath this, further support can be expected at $0.07 and $0.065.
What Are the Technical Indicators Showing?
The RSI has recently dropped from overbought conditions, but has managed to remain above the 50 level. If the RSI can rebound from here, we can certainly expect ADA/USD to continue higher above the $0.09 level.
Conclusion
Cardano can easily increase by 20% and reach the $0.1 target level in the remainder of Q2 2019. However, the market will need to contest significant resistance at the $0.09398 level. If the buyers can push beyond here, they will be free to make an attempt at the target level.