
- Bitcoin has recently plummeted below the $4,000 handle again as it now trades at support around $3,700.
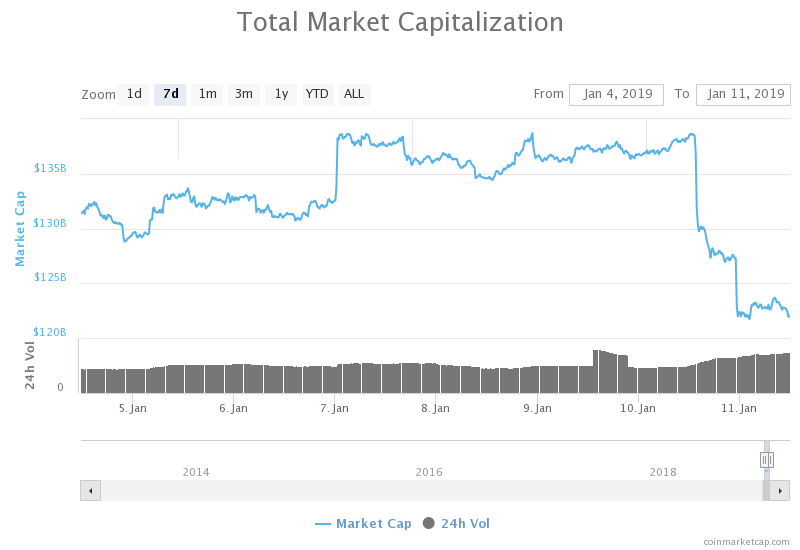
- The total market cap has lost a total of $17 billion over the past 24 hours.
- Support moving forward: $3,701, $3,664, $3,600, $3,500, $3,468, $3,352, $3,228.
- Resistance moving forward: $3,851, $4,001, $4,100, $4,215, $4,342, $4,576, $4,710, $4,877, $4,931, $5,000, $5,116.
Latest Bitcoin News
The Bitcoin market has taken a beating over the past 24 hours of trading, losing a close to 10% and bringing the current trading price back down to $3,707, at the time of writing.
It seemed that the market had started on a good note for 2019 as price action soared above $4,000. However, many prominent analysts were not convinced that this was the end of the “crypto winter” as they believed that the market still had room to head much lower before the correction could take place.
Although Bitcoin has not fallen too far below the $4,000 handle, it looks that they may be correct in thinking that the road ahead may still be tough as Bitcoin may indeed re-test the $3,000 handle or, worse even, head within the $2,000 range.
The total market cap of the entire cryptocurrency market had lost over $17 billion in a short 24-hour period. On January 10, 2019m the market had held a $138 billion market cap and looked that it had the potential to head higher.
However, as the day unfolded, we saw the market cap drop by a significant $17 billion to the $121 billion handle.
Let us continue to take a look at price action over the recent period and continue to highlight any potential areas of support and resistance moving forward.
BTC Price Analysis
Bitcoin is currently trading at the $3,707 handle after losing 4.42% over the previous 7 days of trading. The market is still up a total of 7.78% over the past 30 trading days but the latest price drop may indicate that price action is ready to head further lower.
Bitcoin now holds a merger $64 billion market cap value after undergoing a serious 41% price drop over the past 90 trading days. The 61-month old project now trades at a value that is 81% lower than the all-time high price.
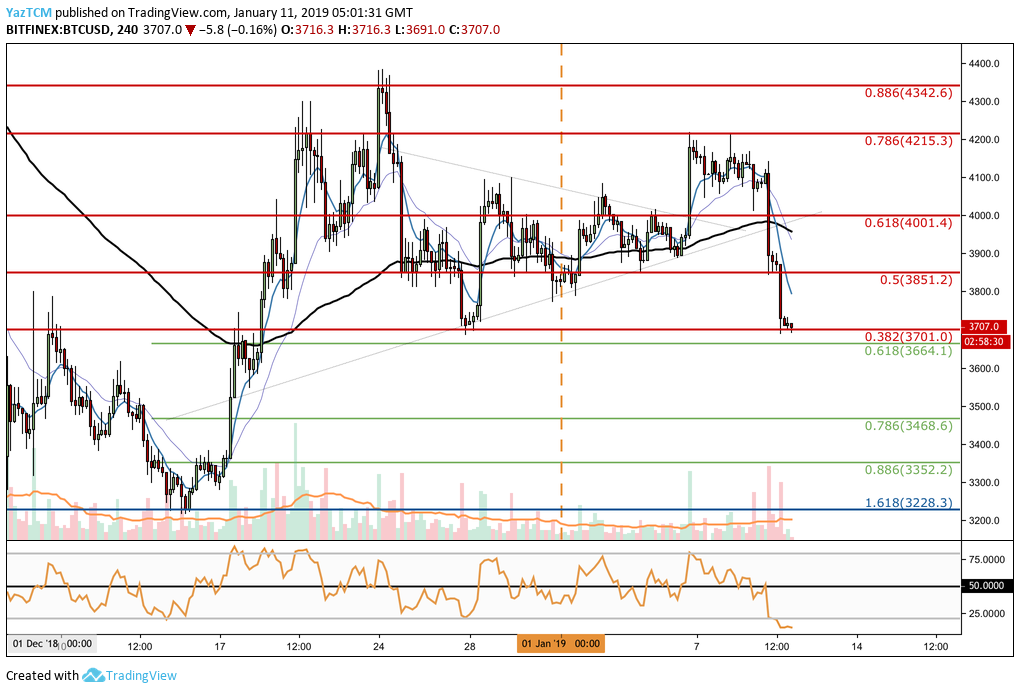
Analyzing price action for BTC/USD from the 4-hour chart above, we can see that since our recent analysis, the market was unable to overcome the resistance at the bearish .782 Fibonacci Retracement level (drawn in red) priced at $4215.
After twice testing the resistance area, the market began to buckle and rolled over.
Price action then went on to plummet below the support at $4,000 and continued toward the support at the bearish .5 FIbonacci Retracement level (drawn in red) priced at $3,815. Price action remained at this support for a few hours but the bears were not finished and managed to push the market lower.
BTC/USD is now trading at support provided by the bearish .382 Fibonacci Retracement level (drawn in red) priced at $3,701. The bulls do look like they are attempting to hold this level but we will need to see some more signs to be convinced that it won’t head further lower.
Trend: Bearish in the Short Term
The recent collapse below the $4,000 handle and the subsequent break below the $3,851 handle has now rendered the current short-term trend as bearish.
If the market does break below $3,701, the trend will be a strong bearish trend which may see BTC/USD head back toward the recent low at $3,228.
For this market to be considered bullish again, we would need to see price action break above the $4,000 handle and break above the resistance at the $4,215 handle.
Where is the Support for BTC Below $3,700?
If the sellers continue with their selling over the next few days and cause the market to break below $3,700, we can expect immediate support towards the downside to initially be located at the short-term .618 Fibonacci Retracement level (drawn in green) priced at $3,664.
This Fibonacci Retracement is measured from the low seen during December 2018 to the high of $4,342 seen towards the end of December 2018.
If the selling pressure continues and causes BTC/USD to break further below the $3,500 handle, more support can then be located at the short-term .786 and .886 Fibonacci Retracement levels (drawn in green), priced at $3,468 and $3,352 respectively.
If the bears continue to break below the $3,300 handle, then the final level of support to highlight in the short term is located at the previous downside 1.618 Fibonacci Extension level (drawn in blue) priced at $3,228.
Where is the Resistance Towards the Upside?
If the bulls can hold the support at $3,701 and begin to climb higher once again, we can expect immediate resistance towards the upside to be located at the bearish .5 and .618 Fibonacci Retracement levels (drawn in red), priced at $3,851 and $4,001 respectively.
If the buyers can then continue to climb above the $4,000 handle, then higher resistance will be located at the January 2019 high located at the bearish .786 FIbonacci Retracement level (drawn in red) priced at $4,215. This is followed by the bearish .886 Fibonacci Retracement level (drawn in red) priced at $4,342.
What are the Technical Indicators Showing?
The RSI on the 4-hour chart is reading as extremely oversold conditions which may indicate that the market will hold the $3,701 handle in the short term to give the bears some breathing room before they want to continue lower.
The RSI on the daily chart has recently plummeted below the 50 handle which indicates that the bears have resumed control of the market momentum.
This will be an important indicator to watch over the coming days because if the bears continue to dominate the momentum and push the RSI even lower, then we could easily see BTC/USD head back toward the $3,200 handle.
Conclusion
The recent collapse back below $4,000 has rendered the market trading condition as bearish.
However, if BTC/USD can remain above $3,701, or even $3,664, then we could see price action recover back above $4,000. On the other side, if it does break below $3,664 then traders should prepare for the market to head back toward the December 2018 lows.