
- BTC/USD had seen a short-lived time above the $4,000 and has since returned below to trade around $3,850.
- Bitmain becomes one of the latest companies to lay off a large proportion of its staff.
- Support moving forward: $3,851, $3,801, $3,701, $3,664, $3,468, $3,352, $3,228.
- Resistance moving forward: $4,000, $4,215, $4,342, $4,567, $4,710, $4,877, $4,931, $5,000, $5,360.
Latest Bitcoin News
After a short-lived rally, the cryptocurrency giant Bitcoin has fallen from the high it had reached at a price of around $4,350 and has penetrated back below $4,000 to where it is currently trading around the $3,850 handle.
Bitcoin has had an extremely tough trading year and cryptocurrency-related businesses continue to feel the effects of the sustained year-long price drop in 2018.
Cryptocurrency projects such as Steem and ETCDev have already laid off 70% of their workforce or have completely cut the entire operation. However, the “restructuring” has now seeped into other types of cryptocurrency businesses, the latest being Bitmain.
Based in China, Bitmain is the largest manufacturer and distributor of Bitcoin and cryptocurrency mining hardware.
Their chips are designed to allow users to mine Bitcoin and other cryptocurrencies with the best available hardware. The company had initially seen an exceptional year in 2018 as they invested heavily into an artificial intelligence division, increased their operation to a workforce above 3,000, and were touted to be added to the Hong Kong Stock Exchange after receiving an $8 billion valuation.
However, the company is now in the process of drastic layoffs as they intend on cutting up to 50% of their established workforce as well as closing entire divisions altogether such as their BCH division. The company has made a statement claiming to make “adjustments to the staff” in an “attempt to build a long-term, sustainable and scalable business.”
This development has put more doubt on the company’s finances which may lead people to believe that they are still not prepared to be listed on the Hong Kong Stock Exchange anytime soon.
Let us continue to take a look at price action for Bitcoin over the short term and highlight any potential areas of support and resistance.
BTC Price Analysis
Bitcoin has seen a price fall totaling 1.20% over the past 24-hour trading period as price action now trades at a price of $3,860, at the time of writing.
The cryptocurrency has seen a further 3.23% price drop over the past 7 trading days but has found some form of stability. BTC has seen only a small decline totaling 0.83% throughout the past 30 trading days.
Bitcoin is still ranked as the number 1 cryptocurrency and presently retains a $66.16 billion market cap value. However, the 68-month old cryptocurrency is now trading at a value that is 80% lower than the all-time high price after losing a considerable 42% over the past 90 trading days.
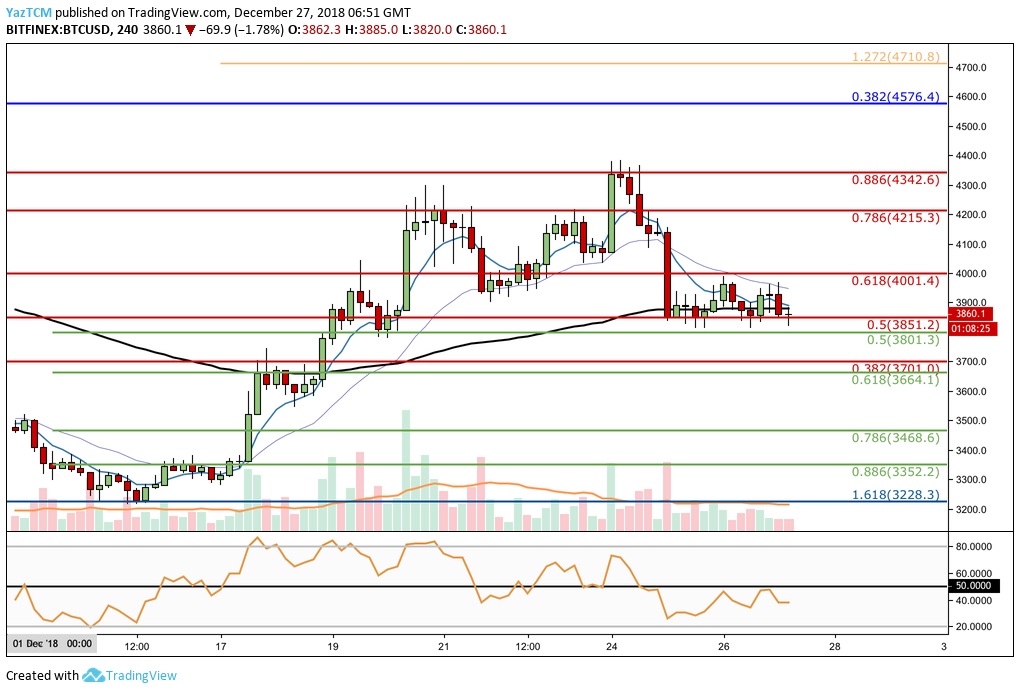
Analyzing price action for BTC/USD from the short-term perspective above, we can see that from December 16, 2018, BTC/USD had bounced from support provided by a long-term downside 1.618 Fibonacci Extension level (drawn in blue) priced at $3,228.
The market went on to rally over the next few days, managing to break above the $4,000 resistance level during the course of the bullish wave.
However, price action met significant resistance at a bearish .886 Fibonacci Retracement level (drawn in red) priced at $4,342. This Fibonacci Retracement is measured from the entire bearish decline seen from the high during November 2018 to the low during December 2018.
The market then rolled-over and began to decline to where it is currently trading at support provided by the bearish .5 Fibonacci Retracement level (drawn in red) priced at $3,851.
Trend: Neutral
The trend is neither bullish nor bearish at this moment in time. For a bullish trend to be established, we would need to see BTC/USD climb and create a fresh high above the $4,400 handle.
For the market to be considered bearish once again, we would need to see BTC/USD continue to fall and penetrate below the support at $3,228.
Where is the Support for BTC Located Beneath $3,851?
If the bears continue to pressure the market further below $3851 we can expect immediate support toward the downside to be located at the short term .5 Fibonacci Retracement level (drawn in green) priced at $3801, closely followed by the bearish .382 Fibonacci Retracement level (drawn in red) priced at $3701.
If the sellers continue to push BTC/USD below $3,700, we can then expect further support to be located at the .618 and .786 Fibonacci Retracement levels (drawn in green), priced at $3,664 and $3,468, respectively.
The final level of support, before BTC/USD re-enters bearish trading conditions, is located at the previous downside 1.618 Fibonacci Extension level (drawn in blue) priced at $3,228.
What If the Bulls Regroup and Push BTC Higher?
If the buyers can regather their momentum and begin to climb higher, they will encounter immediate resistance toward the upside at the bearish .618 Fibonacci Retracement level (drawn in red) priced at $4,001.
Further resistance above this can be expected at the bearish .786 and .886 Fibonacci Retracement levels (drawn in red), priced at $4,215 and $4,342 respectively.
If the bulls can then continue to break above $4,342 and continue to create fresh December 2018 highs, more resistance above can be located at the short-term 1.272 and 1.414 (not shown on the chart) Fibonacci Extension levels (drawn in orange), priced at $4,710 and $4,877 respectively.
Conclusion
The year has been a gruesome year for Bitcoin holders and businesses alike.
During the epic bullish run, we saw many companies on-boarding large amounts of staff and not many people questioned the sustainability of their expansions. However, as evidenced by the latest company lay-offs, in such a volatile market, if a business does not plan ahead, it is bound to struggle at some point down the line.