
- Support for BTC moving forward: $3,664, $3,600, $3,590, $3,569, $3,508, $3,467, $3,421, $3,350.
- Resistance for BTC moving forward: $3,802, $3,851, $3,882, $3,906, $3,961, $4,001, $4,040, $4,215.
Latest Bitcoin News
New data has shown that not only is the number of Bitcoin transactions is at their 1-year high, at a level that is close to the late-2017 bull run, Bitcoin transactions fees have now reached fresh multi-year lows as they sit at a price that has not been seen since 2014.
In other Bitcoin news, the much-anticipated Baakt exchange is now scheduled to launch in late 2019. The exchange was expected to launch in late 2018 but then was pushed back to early 2019. However, after waiting for approval from the U.S. Commodity Futures Trading Commission (CFTC), the early 2019 launch did not occur.
There is much eagerness for this exchange launch as investors believe that it will bring in a large amount of institutional investment into the Bitcoin economy. The exchange had also raised over $182 million in a recent funding round.
Bitcoin Price Analysis
Over the past few days, the Bitcoin market has remained relatively stable as price action trades sideways following the unexpected rise seen on February 8, 2019, when Bitcoin price reached a high of $3,802. The market has now seen a 6.36% price increase over the past 7 trading days as the cryptocurrency now trades at the $3,760 handle.
Bitcoin currently holds a $63.61 billion market cap value as the 70-month old veteran now trades at a value that is 81% lower than the all-time high price.
BTC/USD Price
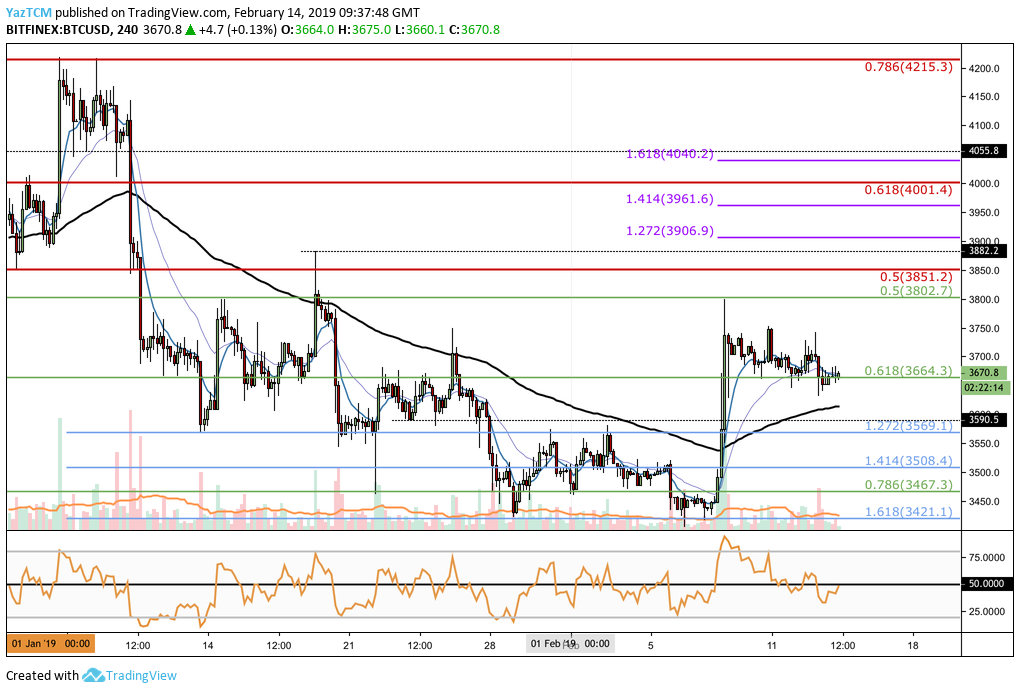
Since our last BTC/USD analysis, price action has dropped slightly as it reached the support identified at the short-term .618 FIbonacci Retracement level (drawn in green) priced at $3,664.
Price action seems to have found a level of solid support at this handle as the bulls battle to prevent price action from breaking below.
Trend: Bullish
As the market has not yet broken below the $3,664 handle, we can assume that the current trend remains bullish.
However, over the past few days the market has pretty much traded sideways, so the short-term trend can be considered neutral. If price action breaks below $3,664, the overall market trend will return to a neutral trend.
For this market to be considered bearish, we would need to see price action break below the $3,500 handle.
Where is the BTC Market Likely to Head Towards Next?
If the bulls can continue to hold the support at the short-term .618 Fibonacci Retracement level (drawn in green) priced at $3,664 and begin to climb higher, we can expect immediate higher resistance located at the short-term .5 FIbonacci Retracement level (drawn in green) priced at $3,802.
If the bulls can break above $3,802 and create a fresh high, there is more resistance above closely located at the bearish .5 Fibonacci Retracement level (drawn in red) priced at $3,851, followed by higher resistance at the $3,882 handle.
If the buyers continue to climb above $3,882, more resistance above can be expected at the short-term 1.272 and 1.414 FIbonacci Extension levels (drawn in purple) priced at $3,906 and $3,961, respectively. This is followed by more resistance at the bearish .618 Fibonacci Retracement level (drawn in red) priced at $4,001.
What if the Bears Push the Market Below the $3,664 Level?
If the sellers manage to push BTC/USD below the support at the $3,664 handle, we can expect immediate support beneath at the $3,590 handle, followed by more support at the previous short-term downside 1.272 and 1.414 Fibonacci Extension levels (drawn in blue), priced at $3,569 and $3,508 respectively.
If the bears cause BTC/USD to break below $3,500, there is more support below located at the short-term .786 FIbonacci Retracement level (drawn in green) priced at $3,467. There is then more support at the short-term downside 1.618 Fibonacci Extension level (drawn in blue) priced at $3,421.
If price action drops below $3,421, creating a fresh low for 2019, more support below can be located at the short-term .886 FIbonacci Retracement level priced at $3,350, not displayed on the chart.
What are the Technical Indicators Showing?
The RSI on the 4HR chart has recently slipped under the 50 handle which indicates that the bears had taken control of the short-term market momentum.
However, the RSI has now returned directly on the 50 handle which indicates that neither the bulls nor the bears are in control of the market momentum at this moment in time.
Conclusion
The price surge witnessed last week has introduced optimism within the BTC/USD market.
Price action has managed to sustain a large proportion of its move higher and if it can continue to hold at $3,664, we can expect the bullish momentum to continue to push price action higher.