
- Bitcoin has now approached our previously highlighted area of support at the crucial $3569 handle.
- Support moving forward: $3,569, $3,508, $3,464, $3,421, $3,350, $3,266, $3,228.
- Resistance moving forward: $3,664, $3,851, $3,896, $3,942, $4,001, $4,215.
Latest Bitcoin News
The previous trading session saw Bitcoin fall from a high of close to $3,800 to a low around $3,569. The recent market drop has now caused the total market cap of Bitcoin to drop to a low around $62 billion, at the time of writing.
Last week, Bitwage announced that it now supports tax processing for its customers and also allows more firms to have the ability to pay their employees in cryptocurrency.
Another recent piece of Bitcoin news comes from the Federal Reserve of St Louis which has recognized Bitcoin as permissionless and decentralized. Additionally, the bank believes that Bitcoin will not go to zero like many skeptics are claiming.
BTC Price Analysis
Bitcoin has seen a small 0.38% price drop over the past 24 hours of trading, but had seen close to a 6% price fall on Sunday January 20, 2019. The market is now trading at a price around $3,594, at the time of writing, after suffering a 30-day price fall totalling 7.86%.
Bitcoin now currently holds a total market cap value of $62.81 billion after seeing a significant 44% price decline over the past 90 trading days. The 69-month old cryptocurrency godfather is now trading at a value that is 81% lower than its all-time high price.
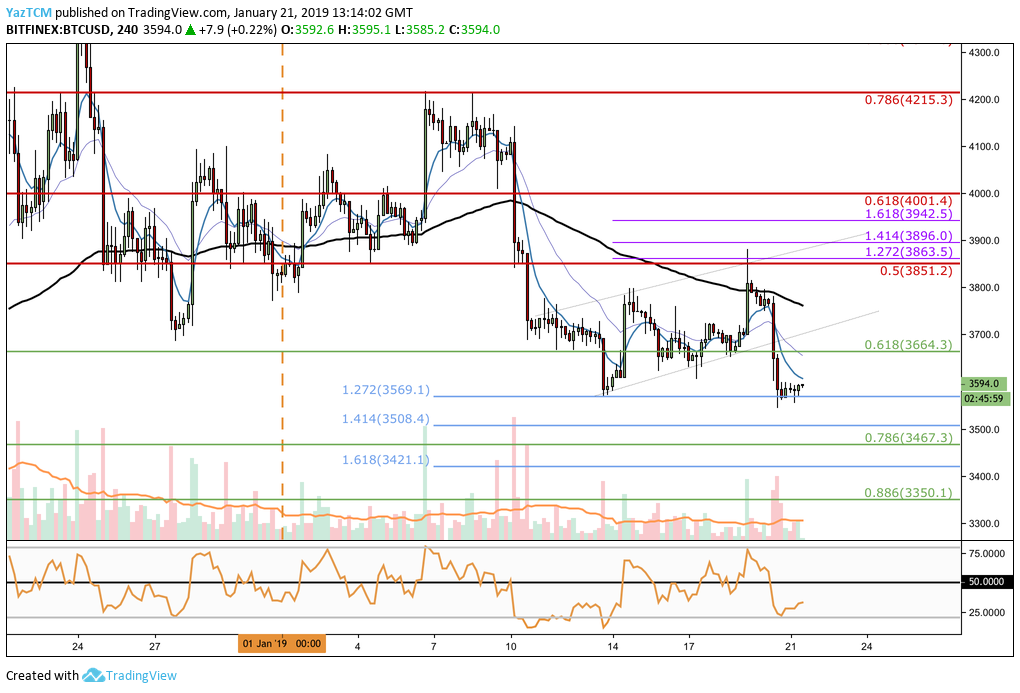
Analyzing the BTC/USD market from the 4-hour perspective above, we can see that since our last Bitcoin analysis, the market went on to ascend for the following 2 or 3 days. It formed a short-term ascending price channel where the market was climbing progressively higher.
Price action managed to reach a high around $3,890 but then met significant resistance at the bearish .5 Fibonacci Retracement level (drawn in red) priced at $3,851. This Fibonacci Retracement level is measured from the high seen in November 2018, before the cryptocurrency market bloodbath, to the low seen in December 2018.
After reaching this high, the market rolled over and began to fall. It fell quite aggressively to below the lower boundary of the short-term ascending price channel.
The bulls tried to defend the short-term .618 Fibonacci Retracement level (drawn in green) priced at $3,664, but failed to do so and BTC/USD dropped even lower.
The market eventually reached support at a short-term downside 1.272 FIbonacci Extension level (drawn in blue) priced at $3,569. In our last analysis, we had outlined this support area as a crucial level for the market to hold to prevent price action from heading lower.
It does look like the bulls have managed to defend the area as the market seems to be in the process of reversing from this identified support zone.
Trend: Neutral
The recent market decline has brought BTC/USD to a neutral trading condition.
However, if price action continues to head below the $3,569 handle, then the current trading condition will immediately turn into a bearish one.
For this market to turn bullish, we would need to see price action heading back above the $3,900 handle.
Where is the Support for BTC Below the $3,569 Handle?
If the market does penetrate below the support at $3,569, turning the trend into a bearish one, we can expect immediate support beneath at the short-term downside 1.414 Fibonacci Extension level (drawn in blue) priced at $3,508.
If the sellers continue to drive price action below the $3,500 handle, more support can then be expected at the short-term .786 Fibonacci Retracement level (drawn in green) priced at $3,46. This is followed closely by support at the short-term downside 1.618 Fibonacci Extension level (drawn in blue) priced at $3,421.
If the selling pressure continues to drive price action for BTC even lower, we can expect more support at the short-term .886 Fibonacci Retracement level (drawn in green) priced at $3,350.
Where is the Resistance Located Towards the Upside?
If the bulls do manage to rebound from the support at $3,569 and begin to climb higher, we can expect immediate resistance above to be located at the short-term bearish .618 Fibonacci Retracement level (drawn in green) priced at $3,664.
Resistance above this can found at the bearish .5 Fibonacci Retracement level (drawn in red) priced at $3,851, closely followed by more resistance at the short-term 1.414 and 1.618 Fibonacci Extension level (drawn in purple) priced at $3,896 and $3,943, respectively.
If the bullish momentum manages to push BTC/USD above the resistance at $4,000, higher resistance above can then be located at the bearish .618 and .786 Fibonacci Retracement levels (drawn in red), priced at $4,001 and $4,215 respectively.
Conclusion
The recent price drop has caused BTC/USD to now reach a crucial area of support.
The next few days will decide whether the market will break below the support level and head further lower, or if the bulls can successfully defend this area of support and begin another recovery attempt above $4,000.