
Bitcoin has seen a recent period of short consolidation over the past 7 days as the cryptocurrency drops by a total of 2%, bringing the current price for the coin down to around $7,774. Regardless of this recent period of consolidation, the cryptocurrency is still up by a total of 39% over the past 30 trading days, with a further 95.55% increase over the past 90 trading days.

Source; CoinCheckup
After such a parabolic price increase within Bitcoin, the period of consolidation that we have recently seen was extremely necessary to give the bulls a little break to regain momentum. However, as some technical indicators show within the BTC/USD market, it seems that the market may be heating up to head toward $10,000.
Crypto Rand, a cryptocurrency analyst and trader with over 212,000 followers on Twitter, recently posted a chart that agrees with the sentiment that Bitcoin is heating up toward 7K:
#Bitcoin heating up for $10K pic.twitter.com/34jIuCocJY
— Crypto Rand (@crypto_rand) May 19, 2019
The first tweet showed BTC with a suggestion that Bitcoin will consolidate in an acute symmetrical triangle before climbing further higher toward $10,000. Crypto Rand then followed up later with another tweet that showed Bitcoin had turned away from the upper boundary of this triangle and is trending downward. However, Crypto Rand holds that we should not be worried.
Nailed the local top. #Bitcoin still on track and following my path. No reasons to be worried for now. pic.twitter.com/bH5Sj1dMZd
— Crypto Rand (@crypto_rand) May 23, 2019
Bitcoin currently holds a $137 billion market cap value, as the cryptocurrency continues to build toward the $150 billion market cap valuation milestone.
Let us move forward and take a look at the BTC/USD market to highlight some potential areas of support and resistance moving forward.
Bitcoin Price Analysis
BTC/USD – MEDIUM TERM – DAILY CHART
What Has Been Going On?
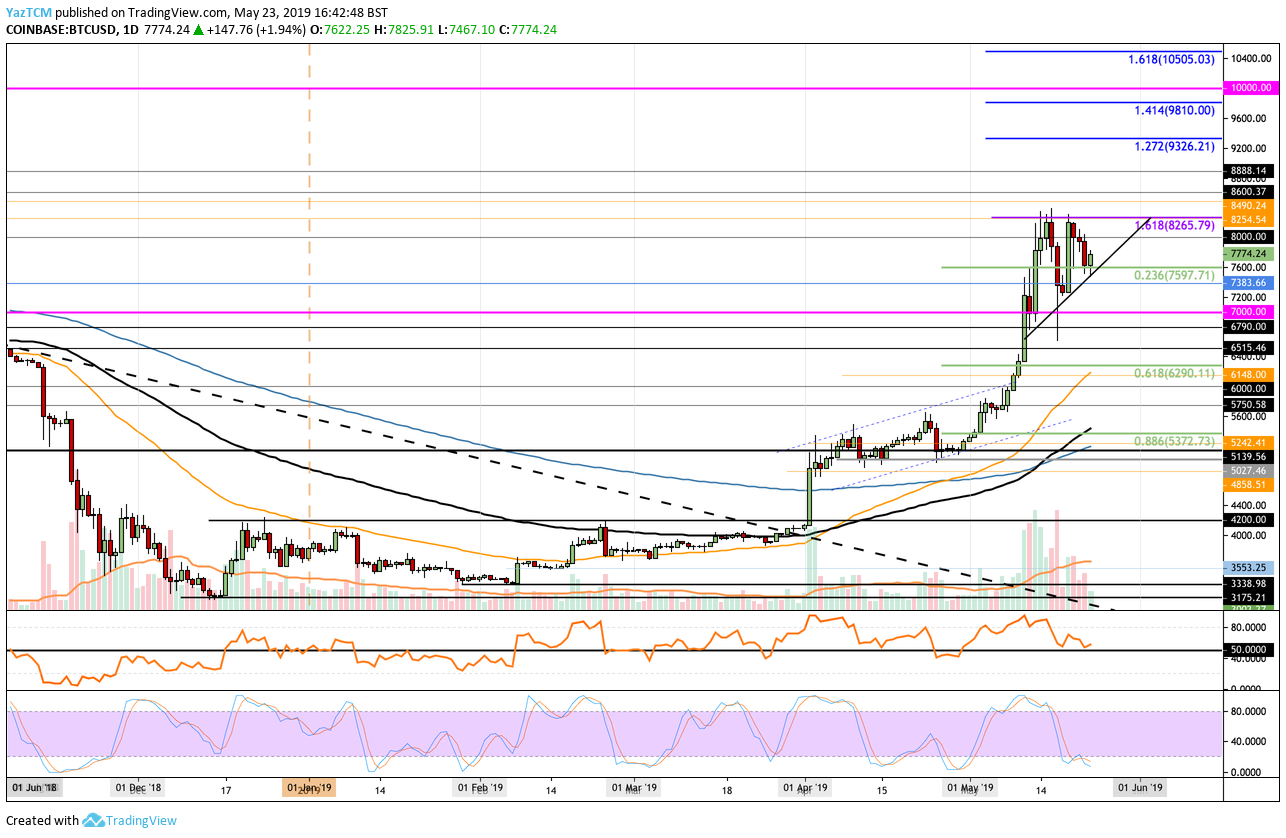
Analyzing the daily BTC/USD chart above, we can clearly see the resistance that Bitcoin experienced at $8,265 during May 2019, provided by a short-term 1.618 Fibonacci Extension level (drawn in purple).
Bitcoin has struggled to break above this level of resistance and has formed a double top in this area. However, on the retracement, Bitcoin has managed to find support at a rising support line that has now formed an ascending wedge formation, with the top of the wedge at $8,265. (this is slightly different from the technical pattern drawn by Crypto Rand, largely due to different exchange prices, but they both show the same period of consolidation)
What Is the Current Trend?
In the short term, as Bitcoin is in a period of consolidation, the trend is neutral until a break above or below the triangle. However, over a longer period, as Bitcoin has increased significantly during the past 3 months, the long-term trend is bullish.
What Are the Technical Indicators Showing?
The technical indicators are in a position that shows a promising sign for the bulls, as they suggest that the market may be finished with the recent period of consolidation.
Firstly, the Stochastic RSI has recently reached extreme oversold conditions and is ready to produce a crossover above signal, which should send a bullish wave higher. Furthermore, the RSI itself has fallen and found support close toward the 50 level. This shows that the previous bullish pressure has had time to rest and prepare for the push higher, while the bears have still not managed to take control of the market momentum.
Are We Heading to $10,000?
Currently, BTC/USD is trading within the ascending wedge formation at support around the short-term .236 Fibonacci Retracement level (drawn in green), priced at $7,597. If the bulls can hold here and push the market higher, we can expect immediate resistance above at the May 2019 resistance level at $8,265.
If the buyers can continue above this level of resistance, we can expect immediate higher resistance above to be located at $8,490 and $8,600. Above $8,600, further higher resistance then lies at $8,888 and $9,000.
If the bullish pressure can continue to drive the market further above the $9,000 level, we can expect more resistance above to be then located at the short-term 1.272 and 1.414 Fibonacci Extension levels (drawn in blue), priced at $9,326 and $9,810. If the bulls can clear these 2 levels of resistance, they will be free to make an attempt higher at the $10,000 resistance level.
What If We Break Below the Triangle?
Alternatively, if the sellers push price action beneath the triangle, we can expect immediate support below to be located at $7,383, $7,200, and $7,000. If the selling continues beneath $7,000, we can expect more support beneath to be located at $6,790 and $6,515.
Conclusion
Bitcoin is certainly showing signs that the recent period of consolidation is starting to finish. If the bulls can push the market above the current resistance around the $8,265 level, we can expect Bitcoin to continue to rise higher and head toward the $10,000 level.