
The past 24 hours has seen another switch of positions, or flippening, amongst the top 5 ranked cryptocurrency projects. After a 6% price increase over the past day, Bitcoin Cash has now sailed into the 4th position in market cap rankings as it overtakes Litecoin.
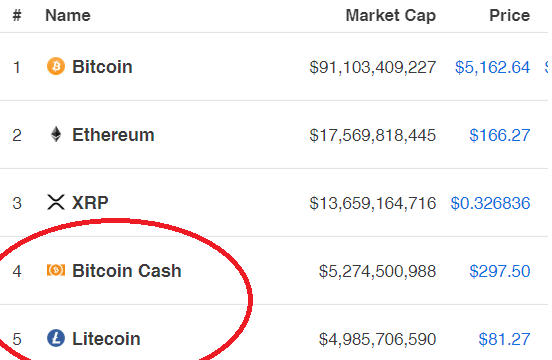
Bitcoin Cash holds a $5.25 billion market cap valuation after the recent price increase, allowing it to overtake Litecoin’s market cap value of $4.96 billion. Both cryptocurrencies have had an impressive bullish run over the previous 90 trading days. BCH has increased by 131% over the period, and Litecoin has increased by 150%.
Despite Litecoin’s significant price increase, it has not been able to prevent Bitcoin Cash from claiming its #4 ranked position. There has been a variety of news lately from Bitcoin Cash which could explain the recent price rise for the project.
One of the most important pieces of news to come out for BCH is the addition of BCH derivatives to the Huobi exchange. This provides another vehicle for investors to trade BCH. The derivatives will also allow traders to open short positions within the cryptocurrency.
Vitalik Buterin had also some great things to say about Bitcoin Cash recently which could have helped the price to increase further. In an interview on Friday April 11 at the Community Ethereum Development Conference, Vitalik had stated that he is watching the price of Bitcoin Cash after the market had risen out of its slump. He went on to continue to state that he also believes that Bitcoin Cash are improving technology wise after they had beaten Bitcoin to implementing Schnorr Signatures which had led him to believe there is some technical talent within the project.
Here is a list of all the great things to happen to Bitcoin Cash over the past week;
This Week in BCH https://t.co/hFkdN5txJV #cryptonews #cryptocurrencynews #blockchain #payment #bitcoin #bitcoincash #btc #bch #payments #Ethereum #ico #erc20 pic.twitter.com/tSkwYVZ7L1
— Egon Bitcoin BCH ✌️ (@Egon_01) April 14, 2019
Let us take a look at the Bitcoin Cash market and highlight some potential areas of support and resistance moving forward.
Bitcoin Cash Price Analysis
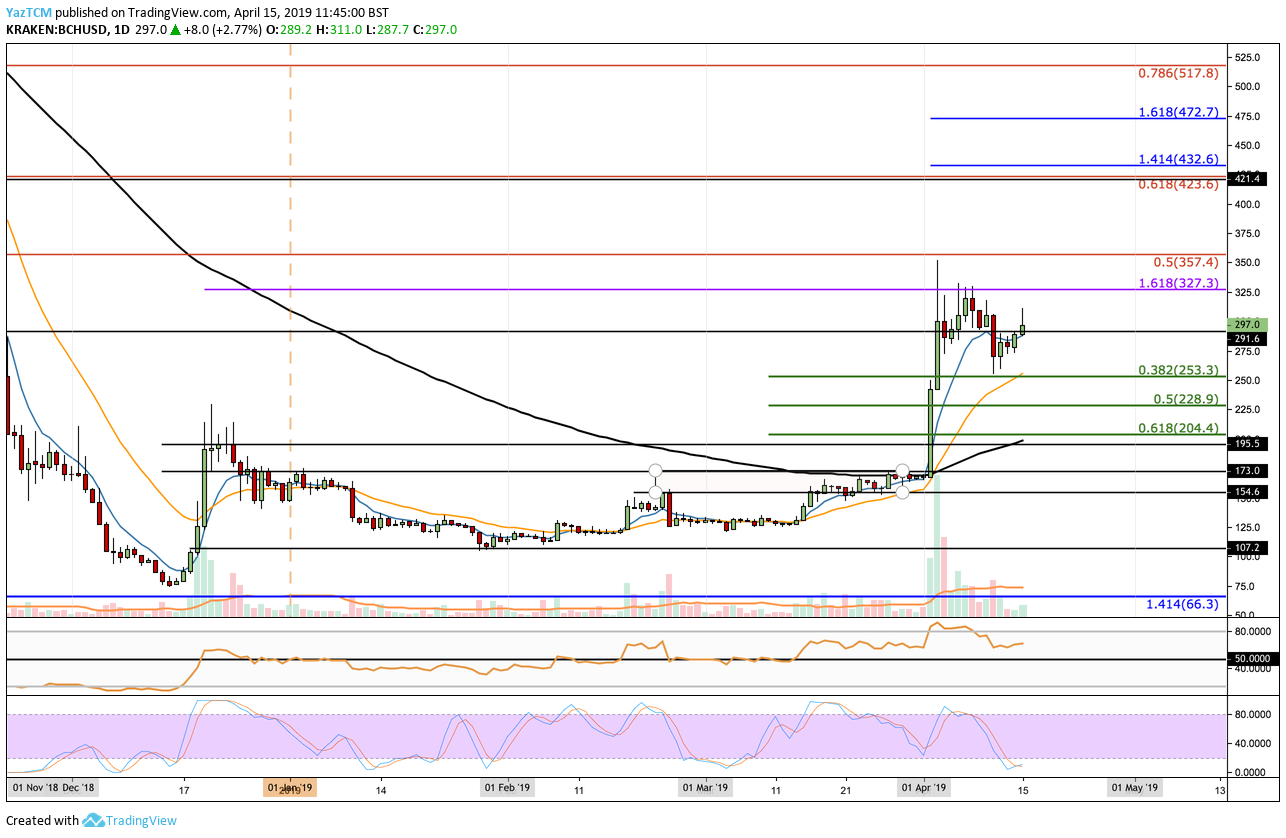
BCH/USD – MEDIUM TERM – DAILY CHART
What Has Been Going On?
Taking a look at the BCH/USD daily chart above, we can see that the market broke above the 100-day moving average during the early-April 2019 price surge. The cryptocurrency went on to rise into higher resistance provided by a 1.618 Fibonacci Extension level (drawn in purple), priced at $327.30.
The market was unable to maintain itself at this level of resistance and proceeded to fall back below the $300 level of the next few days. The recent price spike higher today allowed BCH to break back above $300, but the bears returned and brought the market back below the level to where it is currently trading at $297.
What Is the Current Trend?
The current short-term trend is bullish. For this bullish trend to continue, we would need to see price action break above the $327 level. If the market were to fall beneath the $250 handle, we could consider the market to be bearish in the short term,
Where Can We Go From Here?
If the buyers continue to pressure the market back above $300, we can expect immediate higher resistance to be located at the $327 level. Above this, further resistance can then be located at the bearish .5 and .618 Fibonacci Retracement levels (drawn in red), priced at $357 and $423.
Above $423, more resistance can then be expected at the short-term 1.414 and 1.618 Fibonacci Extension levels (drawn in blue), priced at $432 and $472 respectively. This is then followed with more resistance at the $500 level.
What If the Bears Regain Control?
Alternatively, if the sellers regroup and begin to push the market lower again, we can expect immediate support beneath the market to be located at the $250 level. Beneath $250, further support can then be located at the short-term .5 and .618 Fibonacci Retracement levels (drawn in green), priced at $228 and $204.
What Are the Technical Indicators Showing?
The RSI is above the 50 level, which indicates that the bulls are in control of the market momentum. Furthermore, the Stochastic RSI has recently initiated a crossover above which indicates that the bullish momentum is set to increase further.