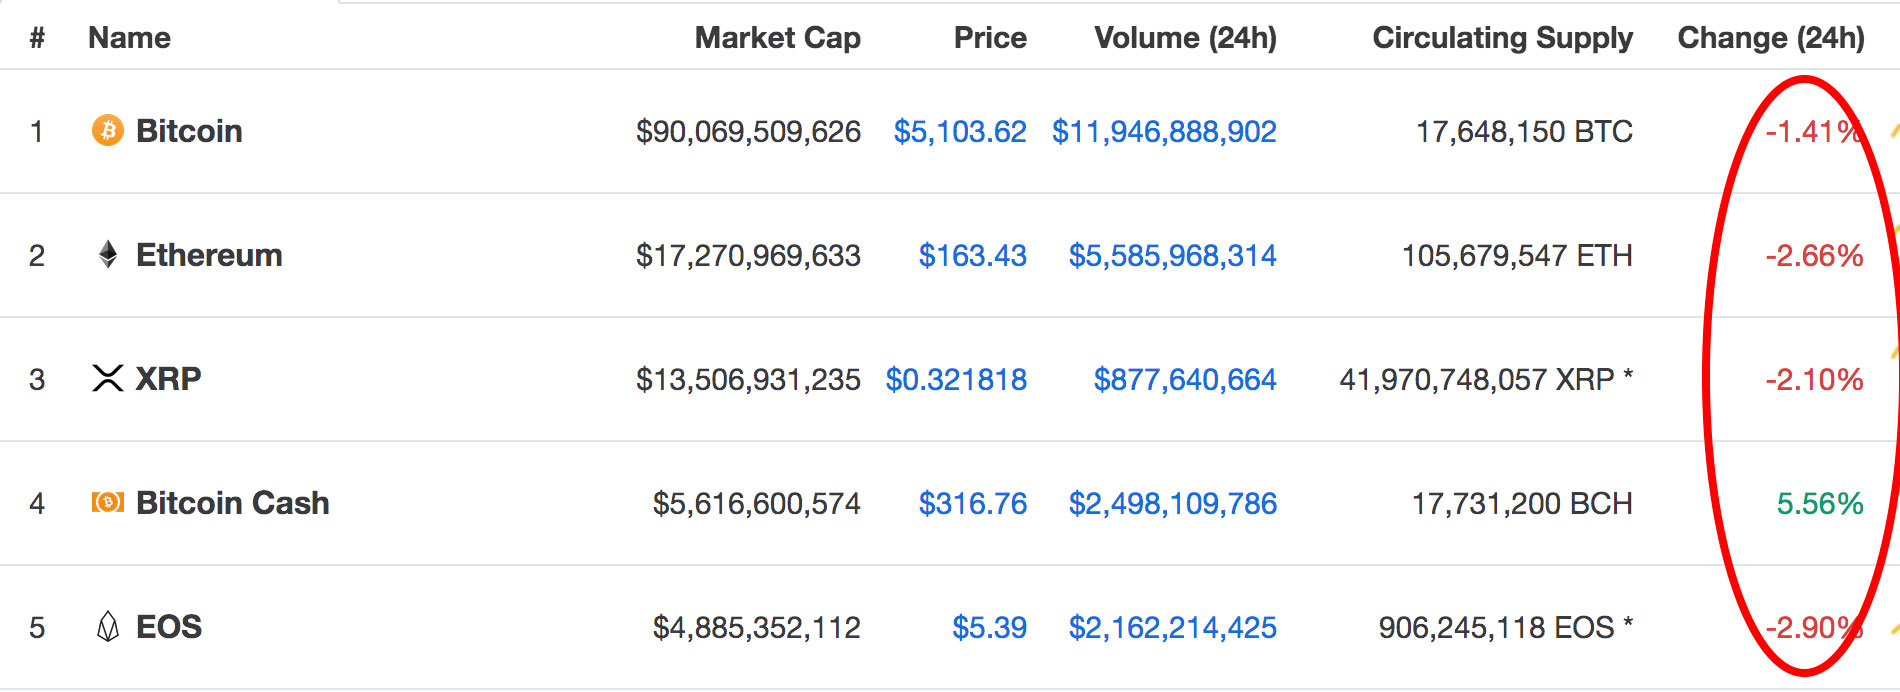
Bitcoin Cash (BCH) has continued to rise by a further 5.77% over the past 24 hours, bringing the current trading price up to around $317. Bitcoin Cash has continued to climb despite the rest of the industry dropping slightly today, as can be seen below:
Bitcoin Cash has seen significant growth over the past few months. Just over the past 30 days alone, the cryptocurrency has increased by a massive 108%. Extending the sentiment to the previous 90 trading days, Bitcoin Cash has surged by a total of 145%.
The most recent price hike has largely been attributed to the troubles that Bitcoin SV has been going through. Bitcoin SV forked out of BCH last year, and ever since the 2 cryptocurrency projects have been competing for market share.
However, things took a turn for the worse over the past few days after BSV receives a wave of de-listings from the largest exchanges including Binance and ShapeShift, with Kraken following suit. After these announcements, Bitcoin Cash surged by over 15%:
The biggest winner in the BSV delisting is…. pic.twitter.com/QZurEKtYA8
— Ran NeuNer (@cryptomanran) April 15, 2019
The 21-month-old project, Bitcoin Cash, remains in 4th position in the market cap rankings, as it presently holds a $5.61 billion market cap value. Their closest competition is now EOS, which sits over $730 million behind BCH at 5th position.
Let us take a look at the BCH/USD market and highlight some potential areas of resistance on the way up for BCH.
Bitcoin Cash Price Analysis
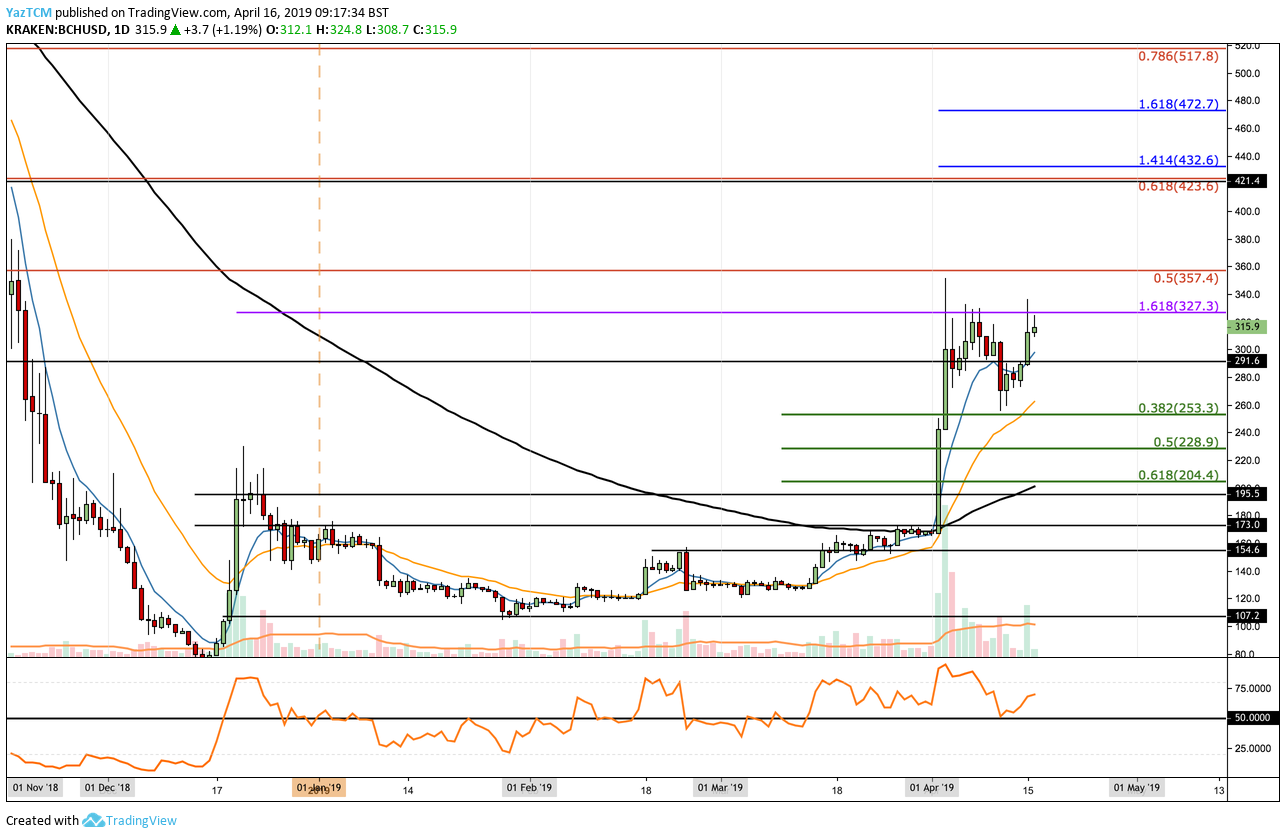
BCH/USD – MEDIUM TERM – DAILY CHART
What Has Been Going On?
Taking a look at BCH/USD above on the daily chart, we can see that over the last trading day, the market surged back up toward resistance at a medium-termed 1.618 Fibonacci Extension level (drawn in purple) priced at $327.
This area provided resistance for BCH during the early April 2019 price surge. If the bulls would like to keep the trend positive for BCH, they will need to break above this level of resistance soon.
Where Is the Resistance Above $330?
If the bears are to succeed in breaking above $327, higher resistance can then initially be located at a long-term bearish .5 Fibonacci Retracement level (drawn in red), priced at $357. This bearish Fibonacci Retracement is measured from the November 2018 high, before the November 2018 bloodbath, to the December 2018 low.
If the bulls continue to drive above the $400 level, higher resistance is then to be expected at the bearish .618 Fibonacci Retracement level, priced at $423. This is then followed with more resistance at the short-term 1.414 and 1.618 Fibonacci Extension levels (drawn in blue), priced at $432 and $472.
If the bullish pressure continues to drive BCH/USD above the $500 level, further resistance is then located at the bearish .786 Fibonacci Retracement level priced at $517.
What Are the Technical Indicators Showing?
The RSI has recently bounced at the 50 level, which indicates that the bulls remain in charge of the momentum within the market. If the RSI can continue to climb higher, we can expect the bullish pressure to increase and BCH to break above the current $327 resistance level.
Furthermore, all of the moving averages are aligned in an extremely strong bullish manner.
Conclusion
Bitcoin Cash has clearly benefited from the blunders committed by Craig Wright and Bitcoin SV. We can see a definite negative correlation between BCH and BSV after major exchanges announcing they would be de-listing BSV, with BCH rising and BSV falling.
If we would like to see BCH rise further higher, the buyers will need to drive price action above the $327 level to create a fresh high for 2019.
Do you think BSV is done for, or will it make a comeback? How high do you think BCH will continue to rise? Let us know in the comments!