
- Support for BTC moving forward: $3,802, $3,664, $3,590, $3,569, $3,508, $3,467, $3,421.
- Resistance for BTC moving forward: $3,851, $3,882, $3,906, $3,961, $4,001, $4,040.
Latest Bitcoin News
Before Bitcoin had created fresh highs above $3,800 in February 2019, the team at Invest In Blockchain had posted a poll on whether the market had already reached the bottom. Out of the 222 people who responded, 41% believe that Bitcoin has indeed reached the bottom.
With the recent surge in BTC price above the $3,800 level, it seems that they could potentially be correct.
In more Bitcoin news, more speed bumps have appeared in the road towards a Bitcoin ETF proposal. The ETF rule change proposed by Reality Shares was recently removed by the company upon the request of the SEC staff. A lawyer for the firm stated that the SEC staff are still taking the position that it is not an appropriate time for the SEC to approve a fund with cryptocurrency exposure and, for this reason, they have withdrawn their rule change proposal.
Another recent piece of news is Luke Dashjr’s (co-founder of Blockstream) suggestion that devs should temporarily reduce the block size of the Bitcoin blockchain from 1MB to 300kb. Although this will hinder scalability in the short term, Dashjr believes that doing so would be in the best interest of the miners.
Bitcoin Price Analysis
Bitcoin has surged by a total of 2.79% over the past 24 hours of trading as price action breaks above $3,800 to where it is currently trading at the $3,822 level, at the time of writing. This break of price action above the $,3800 level has now created fresh February 2019 highs within the market.
The total market cap for the 70-month old godfather of crypto has now risen to $65.73 billion. However, the market still has a long way to recover after losing a total of 32% over the previous 90 trading days.
Let us take a look at price action for Bitcoin over the recent period and highlight some potential areas of support and resistance moving forward.
BTC/USD Price
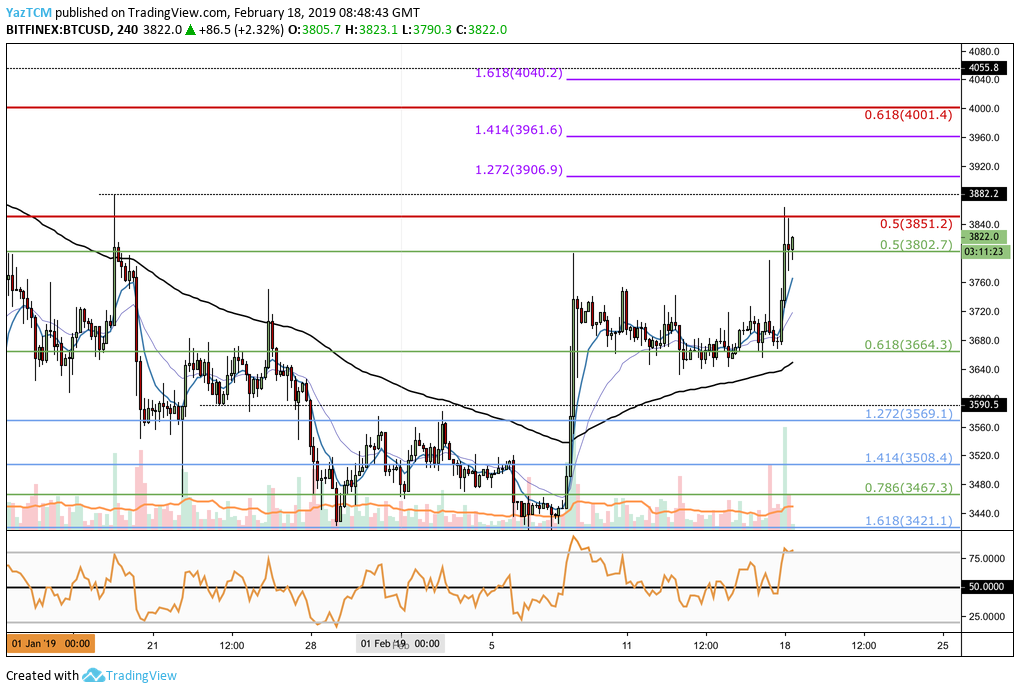
Taking a look at the 4HR BTC/USD chart above, we can see that since our last Bitcoin analysis, price action managed to hold above the identified support at the short-term .618 Fibonacci Retracement level (drawn in green) priced at $3,664.
In the most recent trading period, BTC/USD surged from $3,680 and continued to rise to break above the $3,800 handle. However, the market had met resistance at the bearish .5 FIbonacci Retracement level (drawn in red) priced at $3,851 which caused the bullish pressure to stall.
Price action is now trading comfortably above support at the short-term .5 Fibonacci Retracement level (drawn in green) priced at $3,802.
Trend: Bullish
The trend for Bitcoin continues to remain bullish with the break above the $3,800 handle.
For this market to be considered bearish, we would need to see price action fall and break beneath the support at the $3,664 handle to create a new lower low within the market.
Where is the BTC Market Likely to Head Towards Next?
If the bullish momentum continues, we can expect immediate resistance above at the bearish .5 FIbonacci Retracement level (drawn in red) priced at $3,851. This is followed by higher resistance at the $3,882 level.
If the buyers drive the market above $3,882, there is more resistance towards the upside located at the short-term 1.272 and 1.414 Fibonacci Extension levels (drawn in purple), priced at $3,906 and $3,961 respectively.
If the bullish pressure causes BTC/USD to climb above $4,000, we can then expect higher immediate resistance located at the bearish .618 Fibonacci Retracement level (drawn in red) priced at $4,001. This is then followed by more resistance at the short-term 1.618 FIbonacci Extension level (drawn in purple) priced at $4,040.
What if the Sellers Regroup and Push the Market Lower?
Alternatively, if the bears step back into the market and push price lower, we can expect immediate support at the short-term .5 Fibonacci Retracement level (drawn in green) priced at $3,802.
If the bears cause BTC/USD to break beneath $3,802, more support beneath can be located at the short-term .618 Fibonacci Retracement level (drawn in green) priced at $3,664.
Support beneath the $3,600 level can be expected at the downside 1.272 and 1.414 Fibonacci Extension levels (drawn in blue) priced at $3,569 and $3,508, respectively.
What are the Technical Indicators Showing?
The 4HR chart RSI is well above the 50 handle, indicating the strong bullish momentum within the market.
However, the RSI is approaching overbought conditions which could suggest that the market may pull back slightly before being able to continue to travel higher.
Conclusion
Bitcoin seems to have been reawakened in February 2019 as the market starts to make higher highs once again instead of lower lows.
The recent break above $3,800 will continue to help the positive sentiment within the market to grow as investors become hopeful that the previous long-drawn bear trend may have ceased.
If Bitcoin can break above the resistance at $3,851 and continue higher, we may see the $4,000 handle being cracked pretty soon.