
- Binance has released another preview of its upcoming DEX.
- The BNB token will be migrating away from Ethereum to its own unique blockchain as the DEX is launched.
- Support moving forward: $4.60, $4.19, $4.00, $3.76, $3.58, $3.24, $3.00.
- Resistance moving forward: $5.00, $5.52, $5.90, $6.37, $6.57, $7.00, $7.75, $8.73.
Latest Binance News
The Binance team has recently provided a further in-depth preview of their upcoming decentralized exchange (DEX), slated to launch in early 2019.
The team has already made it apparent that BNB will be switching from its ERC-20 token status on the Ethereum blockchain to its own proprietary blockchain which will be called Binance Chain.
The move over from Ethereum to its own blockchain will allow, according to Binance, millions of entrepreneurs and developers to issue tokens on the brand new blockchain.
A DEX is different to a traditional exchange in the sense that it runs entirely on the blockchain, with no need for a central party to hold your funds. This means that the users will retain full control of their own private keys and subsequently their own coins within their own devices.
This is a crucial step in making the entire industry a more secure and safe environment as centralized exchanges are more prone to hacking attempts and regulatory setbacks.
When the DEX launches on the Binance Chain, it will be able to boast instant transactions — the block time will be 1 second and one confirmation on the Binance Chain will be final.
This is a great feature as it will allow users to send funds instantly to each other without the need to wait for the lengthy confirmations needed on rival blockchains. This allows for a smoother commerce or exchange process to occur.
In other Binance news, the company has announced that they are adding a feature which will allow for institutional investors to create sub-accounts on the Binance cxchange. They’ve also increased the use case for the BNB token as they can now be used to secure hotel bookings on the Tripio platform.
Let us continue to take a look at the Binance market and highlight any important potential areas of support and resistance moving forward.
Binance Coin Price Analysis
BNB/USD has seen a positive price increase totaling 9.44% over the previous 24-hour trading session as the market is currently battling around the $5 handle, at the time of writing.
BNB/USD has seen a 17.91% price decline over the past 7 trading days after a further abrupt and sharp 46% price fall over the past 30 trading days.
The 17-month old project is now ranked in 13th position as it currently retains a total market cap of $660 million.
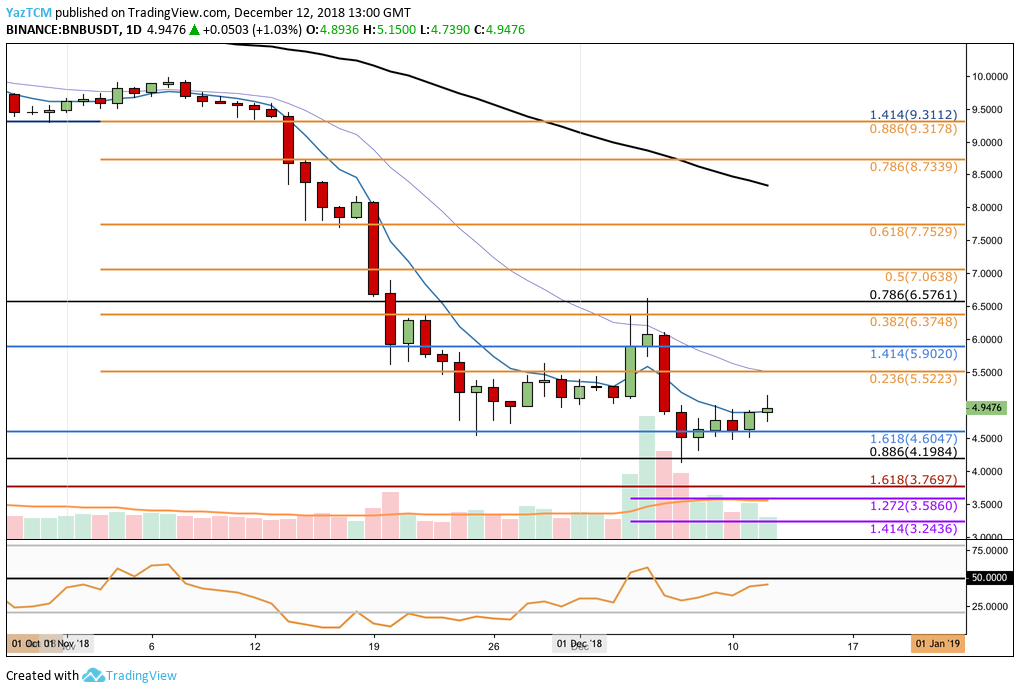
Analyzing the BNB market from the short-term perspective above, we can see that the market bloodbath during November had found support at a long-term downside 1.618 Fibonacci Extension level (drawn in blue) priced at $4.60 toward the end of the month.
As December started to trade, the market momentarily fell lower to the long-term .886 Fibonacci Retracement level (drawn in black) priced at $4.19 before rebounding.
Price action is now trading above the 7-day EMA as the market battles to break above the $5.00 handle.
Trend: Neutral
Although the overall long-term trend is still extremely bearish, the market has found some respite around the support at $4.60.
If price action falls lower and breaks below $4.19, we can consider the market to continue in its bearish action but for now BNB/USD has found some comfort in trading sideways.
For us to able to consider a bullish trend, we would need to see price action break above the $6.57 handle and continue to climb higher.
Where is the Support Located Beneath the Market?
If the sellers to pressure price action lower, we can expect immediate support to be located at the aforementioned support at the $4.60 and $4.19 handles.
If the bearish momentum causes BNB/USD to penetrate below $4.00, we can expect further support beneath to be located at the long-term downside 1.618 Fibonacci Extension level (drawn in red) priced at $3.76.
Further support below $3.76 can then be expected at the short-term downside 1.272 and 1.414 Fibonacci Extension levels (drawn in purple), priced at $3.58 and $3.24.
Where Will the BNB/USD Market Meet Resistance Toward the Upside?
If price action can climb above the $5.00 handle and continue higher, we can expect immediate resistance toward the upside to be located at the short-term bearish .236 Fibonacci Retracement level (drawn in orange) priced at $5.52, followed by the previous downside 1.414 Fibonacci Extension level (drawn in blue) priced at $5.90.
Further significant resistance above the $6 handle can be located at the long-term .786 Fibonacci Retracement level (drawn in black) priced at $6.57, followed by the short-term bearish .5 and .618 Fibonacci Retracement levels (drawn in orange), priced at $7.06 and $7.75 respectively.
What Are the Technical Indicators Showing?
The RSI is rising as it continues to approach the 50 handle once again. This indicates that the sellers have run out of steam within the market.
If the RSI can continue above the 50 handle, we can expect BNB/USD to go on to recover some of the recent losses seen over the past 30 trading days.
Conclusion
BNB moving away from the ERC-20 network to its own blockchain can only be seen as a positive for the company as it continues along its roadmap to provide the best trading solutions for cryptocurrency investors.
The BNB market seems to showing the signs that it is in the midst of a reversal. However, we must wait for a confirmation that the trend is indeed bullish before getting ahead of ourselves. This will require a clean break and close above the $6.57 handle.