
Binance Coin Price Analysis
Binance Coin has seen a significant surge in price which totals over 172% since the low of $4.12 seen on December 7, 2018. The market has seen another 15% price increase over the past 24 hours of trading as price action breaks above $11.00 to where it is currently trading at the $11.09 handle, at the time of writing.
Binance Coin is still ranked in 10th position as it currently holds at $1.58 billion market cap valuation. The cryptocurrency is up by a total of 67% over the past 30 trading days, and now is only trading at a value that is 54% lower than its all-time high price.
BNB/USD Price
Taking a look at the BNB/USD daily chart above, we can see that since our last BNB analysis price action has continued to surge higher. The market had taken out resistance at $9.76, $10.00 and $10.38.
BNB price action has now approached resistance at the medium-term 1.618 Fibonacci Extension level (drawn in purple) priced at $11.27.
There is some divergence between the RSI and price action at this moment in time which may indicate that the bulls are slightly overstretched and price action may retrace soon.
Trend: Bullish
The trend remains strongly bullish after the break above $10.00. For this market to now be considered bearish, we would need to see price action break beneath the $8.50 handle.
Where is the Market Likely to Head Towards Next?
If the bullish momentum can continue to drive price action higher and cause BNB/USD to break above the resistance at the medium-term 1.618 Fibonacci Extension level (drawn in purple) priced at the $11.27 handle, we can expect higher resistance to be located at the short-term 1.414 Fibonacci Extension level (drawn in orange) priced at $11.55.
This price level had provided significant resistance for the market during September 2018, and is expected to provide similar resistance moving forward.
If the buyers continue to drive price action above the resistance at $11.55 and break above the $12.00 handle, there is more resistance located at the short-term 1.618 Fibonacci Extension level (drawn in orange) priced at $12.35.
Resistance above the $12.35 level can then be expected at the $13.00 and $14.00 handles, followed by higher resistance at the $14.67 level.
What if the Sellers Resume Control?
Alternatively, if the sellers regroup and begin to push BNB/USD lower, we can expect immediate support towards the downside at the previous medium-term 1.414 FIbonacci Extension level (drawn in purple) priced at $10.38. This is followed by further support at the $10.00 handle.
More support beneath the $10.00 range is then expected at the 1.272 Fibonacci Extension level (drawn in purple) priced at $9.76, followed by more support at the $9.30 and $9.00 levels.
BNB/BTC Price
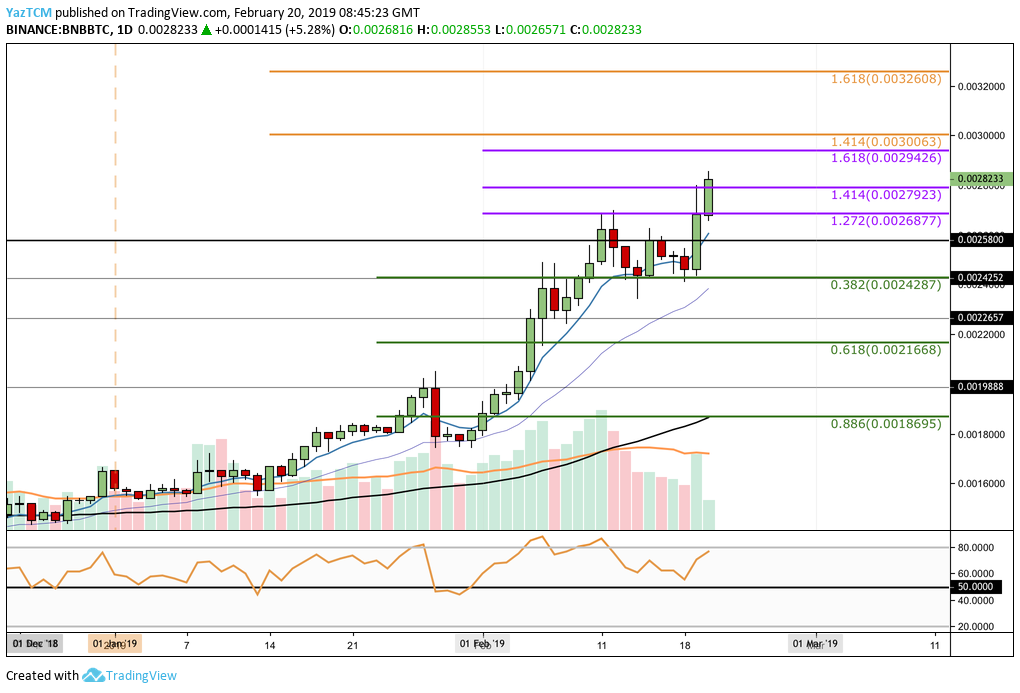
Since our last BNB/BTC analysis, the market managed to penetrate above the resistance at the short-term 1.272 Fibonacci Extension level (drawn in purple), priced at 26,877 SATS.
Price action has continue higher above this to break above the 1.414 Fibonacci Extension level (drawn in purple), priced at 27,923 SATS.
There is also divergence between price action and the RSI which may indicate that a brief market retracement is on the horizon.
Trend: Bullish
The trend for BNB/BTC remains strongly bullish at this moment in time.
For this market to be considered bearish, we would need to see price action break below the 24,287 SATS handle.
Where is the Market Likely to Head Towards Next?
If the bullish momentum can persist and drive BNB/BTC higher, we can expect immediate resistance above at the short-term 1.618 Fibonacci Extension level (drawn in purple), priced at 29,426 SATS.
This is followed by resistance at the medium-term 1.414 Fibonacci Extension level (drawn in orange), priced at 30,063 SATS. If the buyers continue to climb above the 30,063 SATS handle, there is more resistance above located at the medium-term 1.618 Fibonacci Extension level (drawn in orange) priced at 32,608 SATS.
What if the Sellers Regroup?
Alternatively, if the sellers start to push the market lower again, we can expect immediate support towards the downside to be located at the short-term 1.414 and 1.272 FIbonacci Extension levels (drawn in purple), priced at 27,923 SATS and 26,877 SATS.
Further support below this can be found at the short-term .382 FIbonacci Retracement level (drawn in green), priced at 24,287 SATS. If the market breaks below this support, we can then consider the market to be bearish in the short term.
More support towards the downside can then be located at the 22,657 SATS handle. Following this is support at the short-term .618 Fibonacci Retracement level (drawn in green), priced at 21,688 SATS.
Conclusion
The bullish run for BNB since December 2018 has been nothing short of impressive. After rallying by a total of 172%, the market has been the strongest performer in the top 20 cryptocurrencies.
However, the recently-established divergence between price action and the RSI may be the first sign that price action may need to retrace lower slightly before the bullish run can continue higher.