
The crypto winter has been harsh on the majority of players within the industry after Bitcoin and the rest of the cryptocurrency market fell by between -80% to -90% from their all-time high (ATH) prices. Even with Bitcoin’s recent 40% price surge over the past 90 trading days, Bitcoin still trades at a value that is -73% lower than its ATH price.
Despite the conditions of the crypto winter, there’s one cryptocurrency that has managed to climb back toward its ATH price and now only trades at a value that is -20% lower than its ATH price.
After a significant 224% price surge over the past 90 trading days, Binance Coin is now set to become the first cryptocurrency out of the top 20 ranked projects to break above its previous ATH. The cryptocurrency has already broken past its previous ATH against Bitcoin and now looks to follow suit in breaking the ATH price against the USD.
Binance Coin is a cryptocurrency created by the largest crypto exchange in the world, Binance. The cryptocurrency allows traders to receive discounts on trading fees and recently has allowed holders to participate in the cryptocurrency funding rounds for projects on their Binance Launchpad.
After a 30% increase over the past 30 days, Binance Coin is now trading at a price of $19.40. The previous ATH for Binance Coin was on January 12 2018 which had created a high of $25.18. This means that Binance Coin has to rise by $5.78 before it is able to break the ATH price. The cryptocurrency is presently ranked in 7th position on the market cap rankings, as it holds a total value of $2.75 billion.
Let us take a look at the BNB market and highlight some potential areas of resistance on the way up toward the ATH.
Binance Coin Price Analysis
BNB/USD – MEDIUM TERM – DAILY CHART
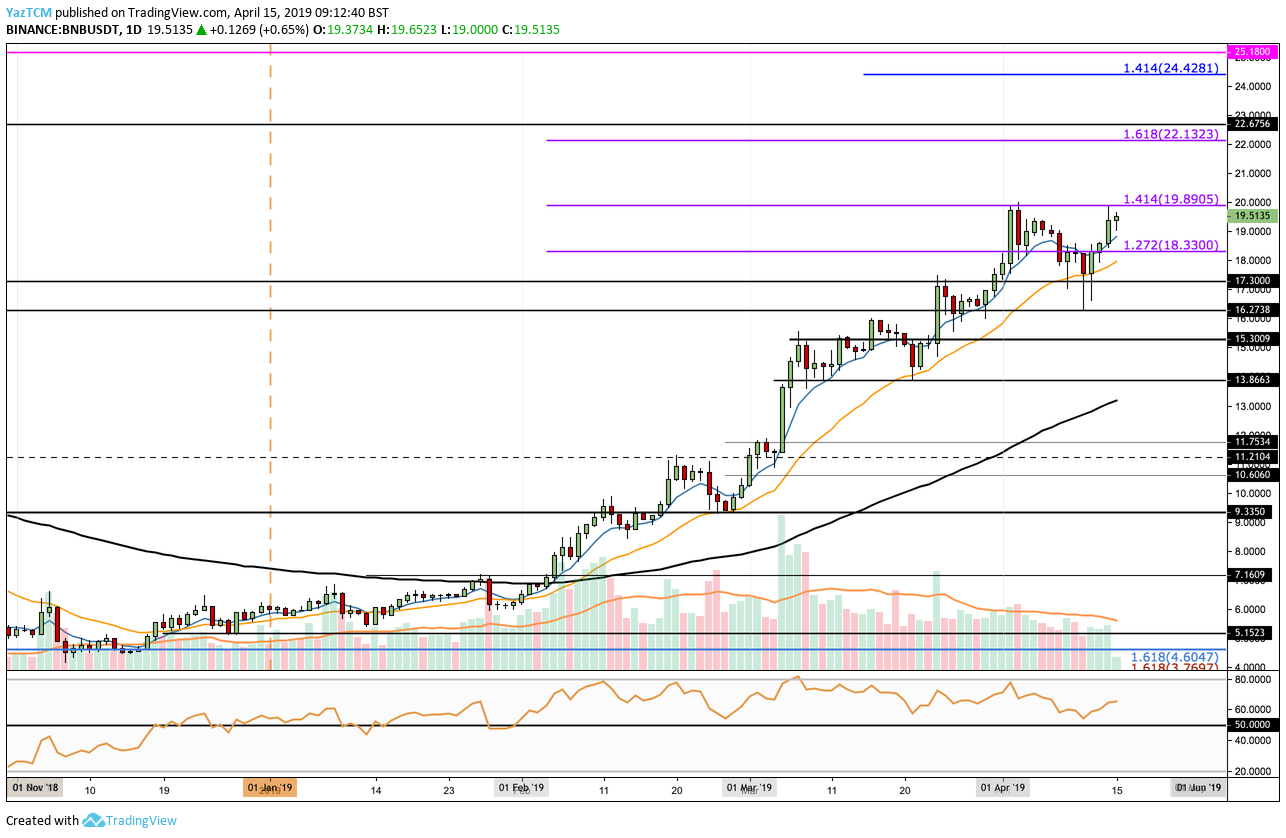
The previous ATH is represented on the chart by a horizontal pink line. We can see that ever since BNB/USD crossed above the 100-day moving average toward the start of February 2019, the market has continued to surge significantly higher.
Price action reached resistance toward the start of April 2019 at a medium-termed 1.414 Fibonacci Extension level (drawn in purple), priced at $19.89. The market climb surged at this area of resistance and rolled over into support around $17.30.
Nevertheless, price action has once again returned to the aforementioned level of resistance in the most recent trading session.
If the bulls continue to increase the pressure and push price action above the $20.00 level, we can expect immediate higher resistance above to be located at $21.00 and then at the 1.618 Fibonacci Extension level (drawn in purple), priced at $22.13.
Above $22.13, higher resistance can then be located a short-term 1.414 Fibonacci Extension level (drawn in blue), priced at $24.42. If the buyers can clear the market above this level, they will be free to make an attempt to break above the previous ATH level around $25.18.
The RSI has remained above the 50 level for the entire period of 2019. This indicates that the bulls are strongly in control of market momentum. If the RSI can remain above 50, we can expect BNB/USD to breach its ATH, hopefully before the end of April 2019.
Let us continue to quickly take a look at BNB/BTC and highlight some areas of potential resistance moving higher.
BNB/BTC – MEDIUM TERM – DAILY CHART
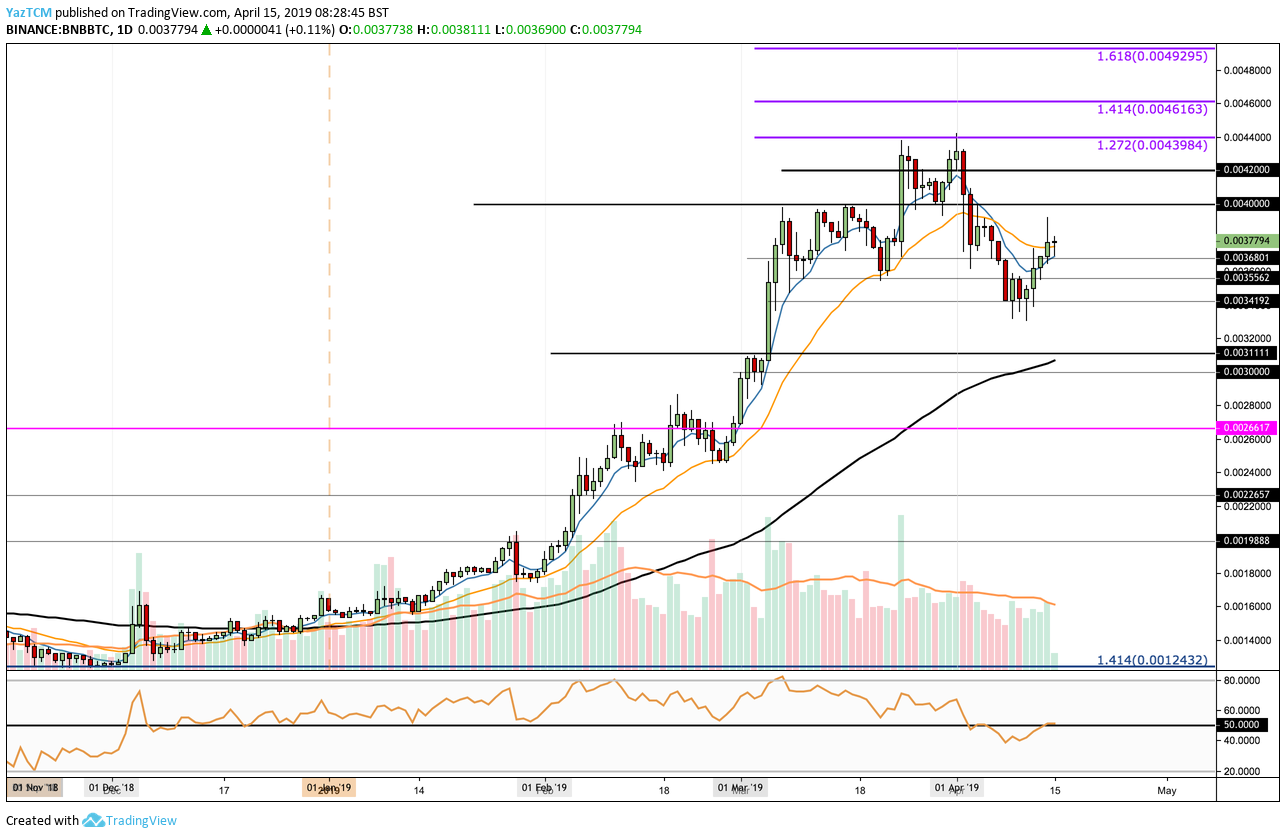
Taking a look at the BNB/BTC market above, we can see that the market had broken above the 100 day moving average toward the end of December 2018. Ever since the break above, BNB/BTC has been soaring.
We can also see that the market broke past its previous ATH during February 2019, when BNB managed to break above the 0.0026617 BTC level. The market has continued to climb significantly higher above this previous ATH after price action met resistance at a 1.272 Fibonacci Extension level (drawn in purple), priced at 0.004398 BTC at the start of April 2019.
Price action has dropped slightly since reaching this level, but recently found support at the 0.003419 BTC level. If the buyers continue to drive BNB/BTC higher again, we can expect immediate resistance to be located at 0.0040 BTC and 0.0042 BTC. Above this, further higher resistance can then be located at 0.004398 BTC and then at the 1.414 and 1.618 Fibonacci Extension levels (drawn in purple), priced at 0.004616 BTC and 0.004929 BTC, respectively.
Conclusion
Crypto winter has indeed caused many coins to struggle tremendously, and the majority of them still have a very long way to climb before approaching their previous ATH prices.
However, Binance Coin remains an outlier after surging significantly throughout 2019. If the bulls can continue to control the market momentum and push the market above the $20.00 resistance level, we could expect Binance Coin to create a fresh ATH as soon as the end of April 2019.