
The crisis continues within the cryptocurrency market as Bitcoin drops to a fresh yearly low of $4,411. This is a price low that the Bitcoin market has not tested since October 7, 2017, over 13 months ago.
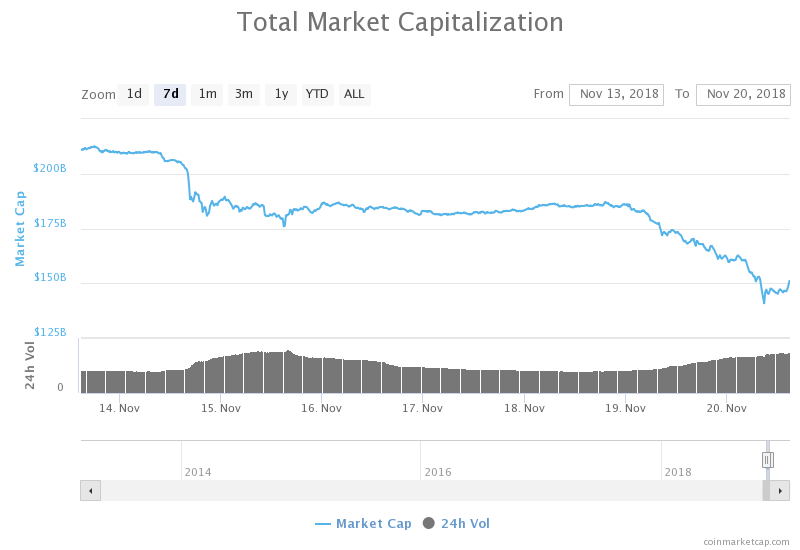
Speculators continue to panic after the initial bloodbath began on November 14, 2018, when the overall market cap for the entire industry fell from $210 billion to $181 billion. Since then, the crypto market cap has continued to slide by a further $40 billion to a low of $140 billion witnessed on November 20, 2018.
This market cap capitulation is displayed in the graph below:
At the time of writing, price action for Bitcoin has attempted somewhat of a small recovery as the market rallies higher to meet resistance around the $4,900 handle.
After such a relentless onslaught from sellers over the past trading week, it can be expected that this potential rebound could be short-lived, and the market could continue further lower until the overall market uncertainty ceases.
Bitcoin
The chart below shows the price drop for BTC/USD over the previous few days.
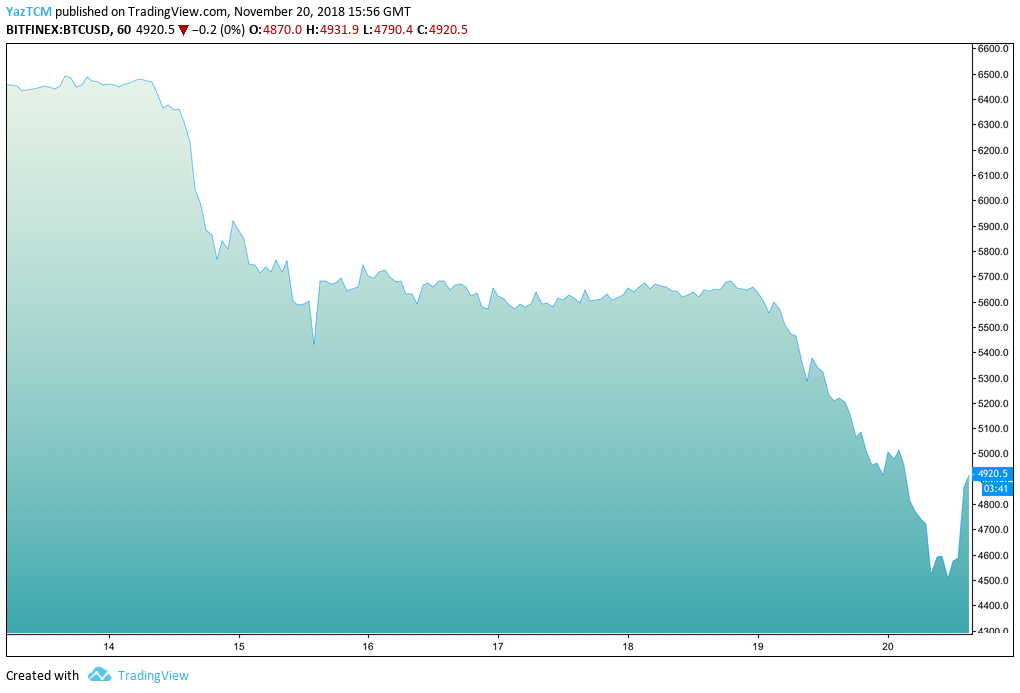
We can see that price action has been within the control of the sellers as the market continued to tumble and reached a low of $4,411. We can also see the attempt for Bitcoin to make a recovery over the previous few hours as it now trades above $4,800.
Moving forward, if the buyers can push price action above the $4,900 handle, we can expect further resistance above at the $4,931 and $5,000 handles.
If the bullish momentum continues further higher, we can then expect higher resistance at the $5,234 handle, followed by more at the $5,576 level.
Alternatively, if the sellers continue with their downward pressure, support below can be found at the $4,713 and $4,625 handles. If the market continues to penetrate below the low of $4,411, we can expect further support beneath at $4,318 followed by $4,168.
The market downtrend came the day before the Bitcoin Cash cryptocurrency was scheduled to hard fork. This coincidence in timing has caused a great deal of uncertainty within the market, leading to many holders to sell their respective cryptocurrencies.
Bitcoin Cash
Bitcoin Cash has plummeted substantially over the past 24 hours of trading, losing as much as 33% as the market now trades around $203, at the time of writing.
The chart below shows BCH/USD over the past few trading days:
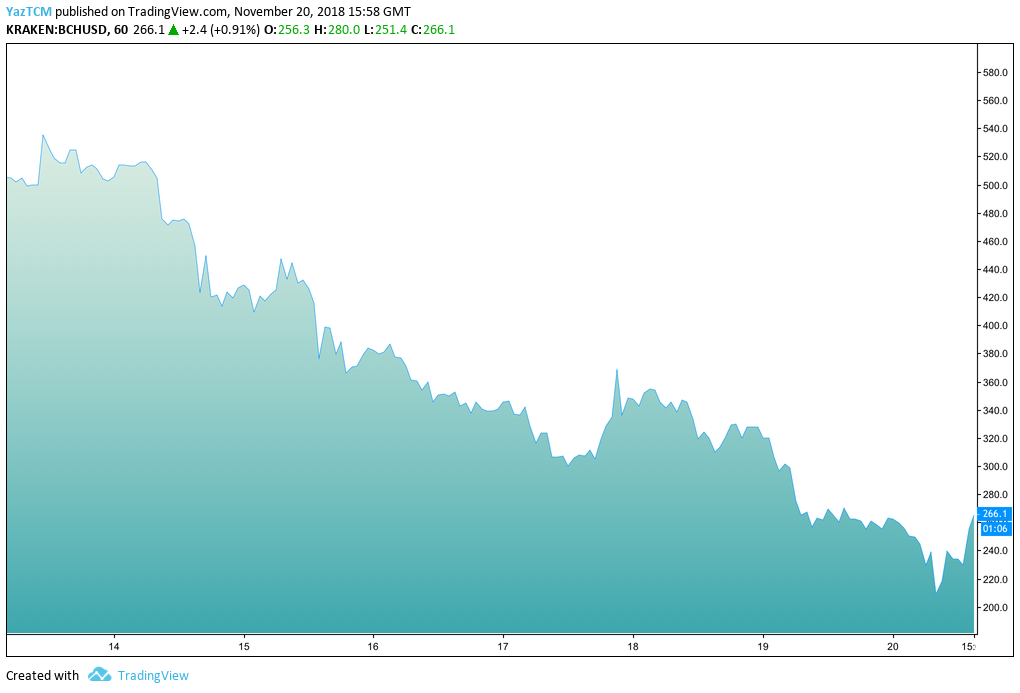
We can see the sustained decline for BCH/USD over the previous few trading days. After the hard fork, price action has continued to nosedive as the overall sentiment remains bearish across the board.
BCH/USD fell from a high above $520 on November 13 2018 to a low of $203, seen recently on November 20, 2018. The market has attempted to regain some of the losses as it trades around $266, at the time of writing.
Moving forward, if the buyers can continue their climb and push the market above the $280 handle, we can expect higher resistance to be located at the $300 handle. Following that, resistance above can be located at the $338, $550 and $376.
The final level of resistance to highlight is at the psychological round number, $400.
Alternatively, if the sellers continue to drive the market back lower, we can expect immediate support below to be located at the $251, $240, $220 and $205 handles. If the bears continue to drive price action below $200, then the next level of support below can be expected at $175, followed by $157.
The Top 10
The rest of the cryptocurrencies within the top 10 have seen similarly disastrous 24-hour trading periods against the USD. Ripple (-7%) and EOS (-9%) have remained the most resilient, as both have sustained less than a 10% drop in price.
BTC, XRP, ETH, CLM LTC, ATA and XMR have all experienced a 24-hour trading period where price action has dropped by as much as 12% to14%. Bitcoin Cash is the worst performer over the past 24 hours of trading as the BCH market has lost as much as 33%.