
Cryptocurrency is a relatively new asset class — with this comes great risk, but also incredible rewards for those who back the right project.
The market is still in the early phases of adoption, with western countries averaging around 6-8% of the population owning a digital currency. This is in stark contrast to the stock market where around 55% of the US population owns a stock.
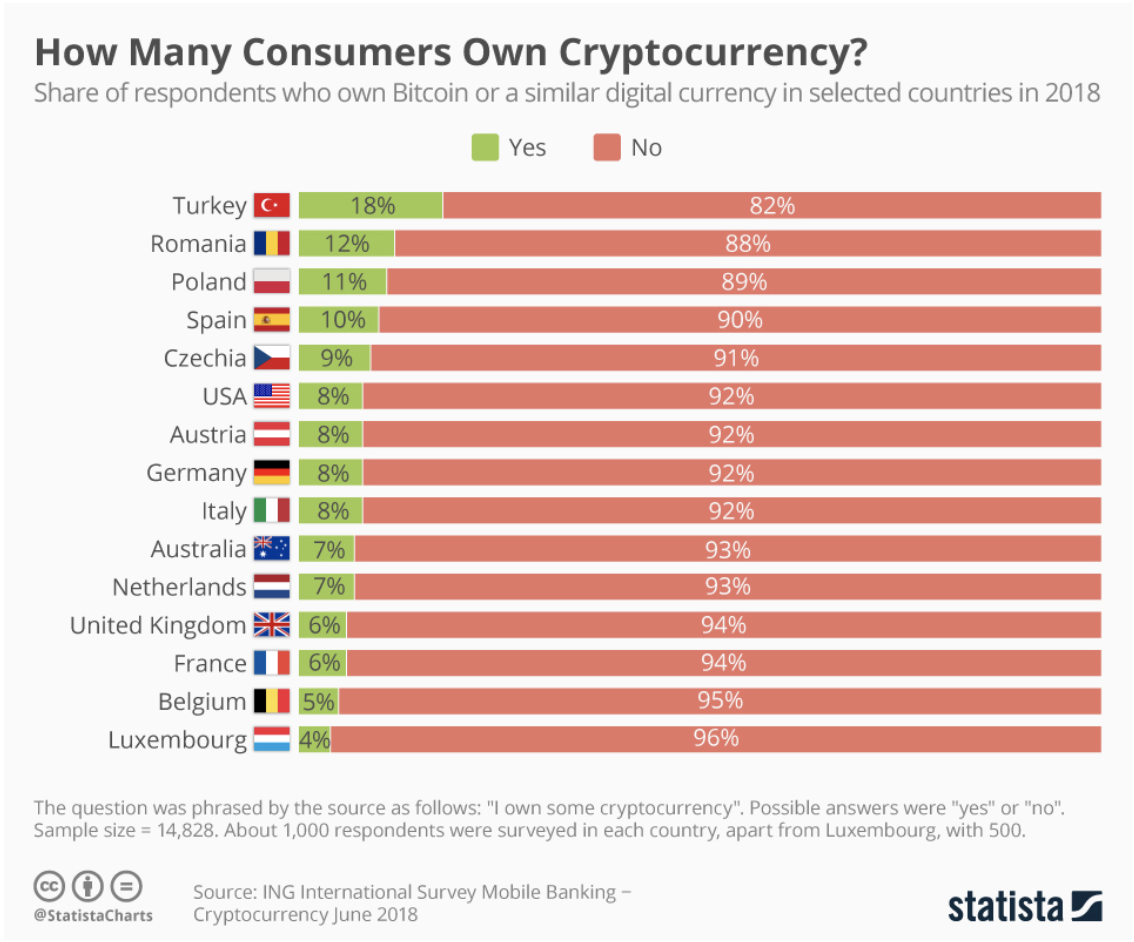 Source: Statistia & ING
The Need for Objective Statistics for Measuring Crypto Valuations
Since the explosion of new token creation in 2017/18, there has been a large focus on ICOs and projects bombarding the market with eye-catching phrases.
Blockchain 2.0, 10,000 Transaction per second scalability, AI deep learning…the list goes on.
This presents a real challenge for new investors already entering an industry which is incredibly technical. Traditional Proof of Work and non-ICO / fair-launch coins can easily be drowned out in all the noise.
With this in mind, today we ask: What empirical evidence is available to us to measure the value of a blockchain project? And how can we use this information to identify if a coin is over or undervalued?
How Stocks Are Measured (P/E Ratio)
A popular metric for value investors to measure whether a stock is over or undervalued is the Price to Earnings Ratio, or P/E Ratio for short.
Investors use P/E Ratio to measure a business’s share price against their earning per share. Analysts can then measure this ratio against other businesses within a similar industry to give a relative scoring, indicating how a stock is valued compared with its competition.
For example:
Stock A has a share price of $11.20 with an earning per-share of $1.60 (P/E Ratio is 7x)
Stock B has a share price of $79.52 with an earning per-share of $4.43 (P/E Ratio is 17.95x)
Stock C has a share price of $61.80 with an earning per-share of $2.57 (P/E Ratio is 24.04x)
In the above example, Stock A is the most undervalued and Stock C is the most overvalued, relative to the market. This provides evidence for an investor of a potential ‘value investing’ play, provided the company has good fundamentals to back up the current low P/E Ratio.
We should note it that there are other metrics that can establish the value of a stock, we have just used P/E Ratios as a well-known example.
Introducing NVT and NVTQ, the Cryptocurrency Market’s Version of a P/E Ratio
With the explosion of new coins, tokens and ICOs, there are many new and innovative models for running a blockchain. Proof-of-Work, Proof-of-Stake, pre-mined supply, fair launch, masternodes, the list goes on. This innovation means a specific criterion has to be established so that apples do not get compared against oranges.
Network Value to Transactions was first proposed by the cryptocurrency researcher Willy Woo as objective measure of tracking bubbles and buying opportunities within Bitcoin and some other altcoins. A full interview with Woo can be found here, which we recommend people interested in this metric review.
Woo originally developed NVT for measuring the value of projects such as Bitcoin or Monero. This makes sense for these cryptocurrencies as they are considered money. In traditional finance, the health of an economy can be looked at by how much money is circulating and central banks track and report this regularly (e.g. in the U.S., this is called M1 or M2 velocity).
Unfortunately, the same logic cannot apply to utility tokens such as Ethereum, EOS or Ubiq as the primary function is for ETH/UBQ to be used as gas to fuel the network. If you have a dapp running on either of these platforms, then the transactional quantity will be high, whilst the USD volume will be relatively low.
Another example is the usage of Ubiq‘s governance token Escher. This token has no financial value. However, it is utilized by participants to vote on key issues effecting the Ubiq network, creating several transactions with next to zero financial volume.
Therefore, we have chosen a modified version of NVT called NVTQ (Network Value to Transactional Quantity) to account for the total number of transactions against the current market cap, instead of the USD metric.
To set out a fair benchmark of the various smart contract platforms, we have set the following parameters for our test:
- Only ‘real’ transactions. We have included no data in the calculations for mined coins in block rewards, any coins claimed by staking or coins distributed to masternodes. All other transactional activity is valid.
- The data used to establish NVT ratios is based on information provided by https://coinmetrics.io and can be audited by anyone if they wish.
- We used market cap data provided by coinmarketcap.com.
- Transaction Quantity (NVTQ) has been utilized to benchmark these platforms.
- We collected The data over a 7-day period from 5pm UTC on September 14, 2018 to 5pm UTC September 21, 2018.
- We pulled Ubiq transactional data from ubiqscan.io explorer.
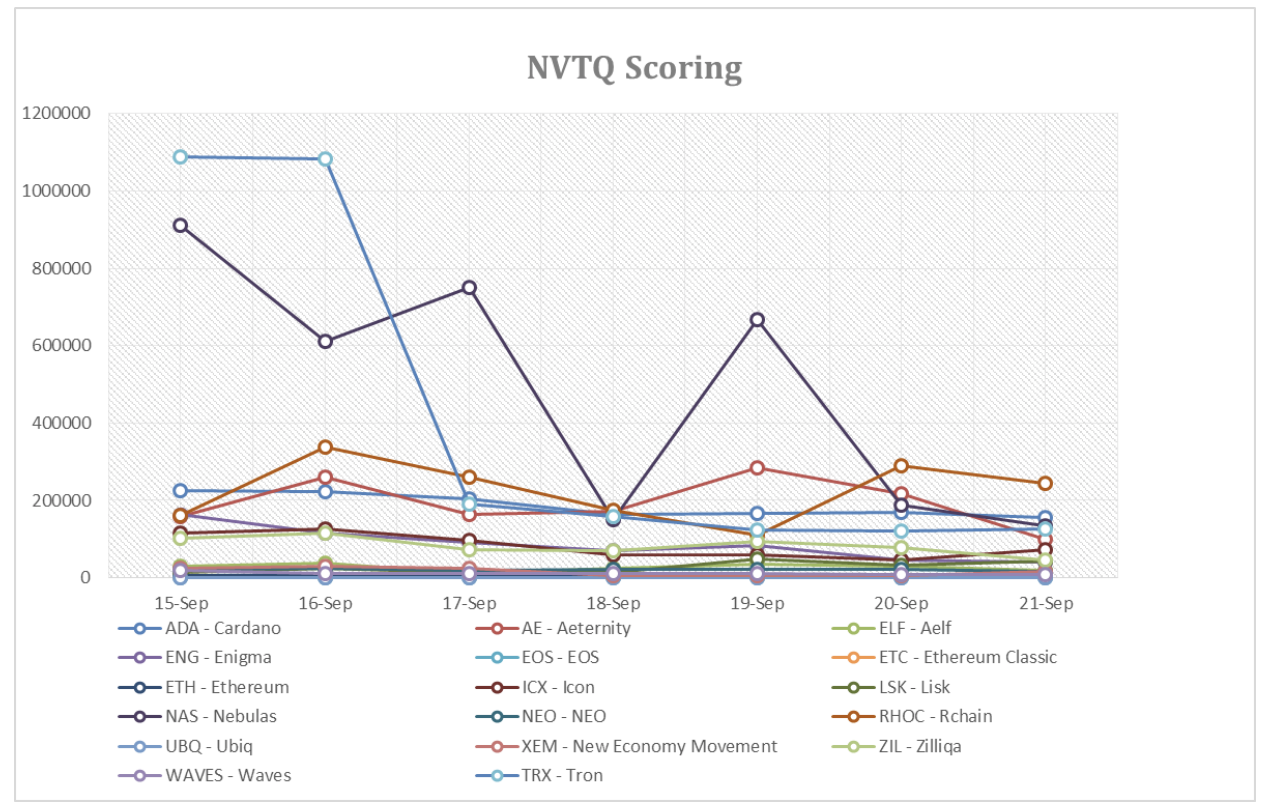
Measuring Smart Contract Platforms by NVTQ
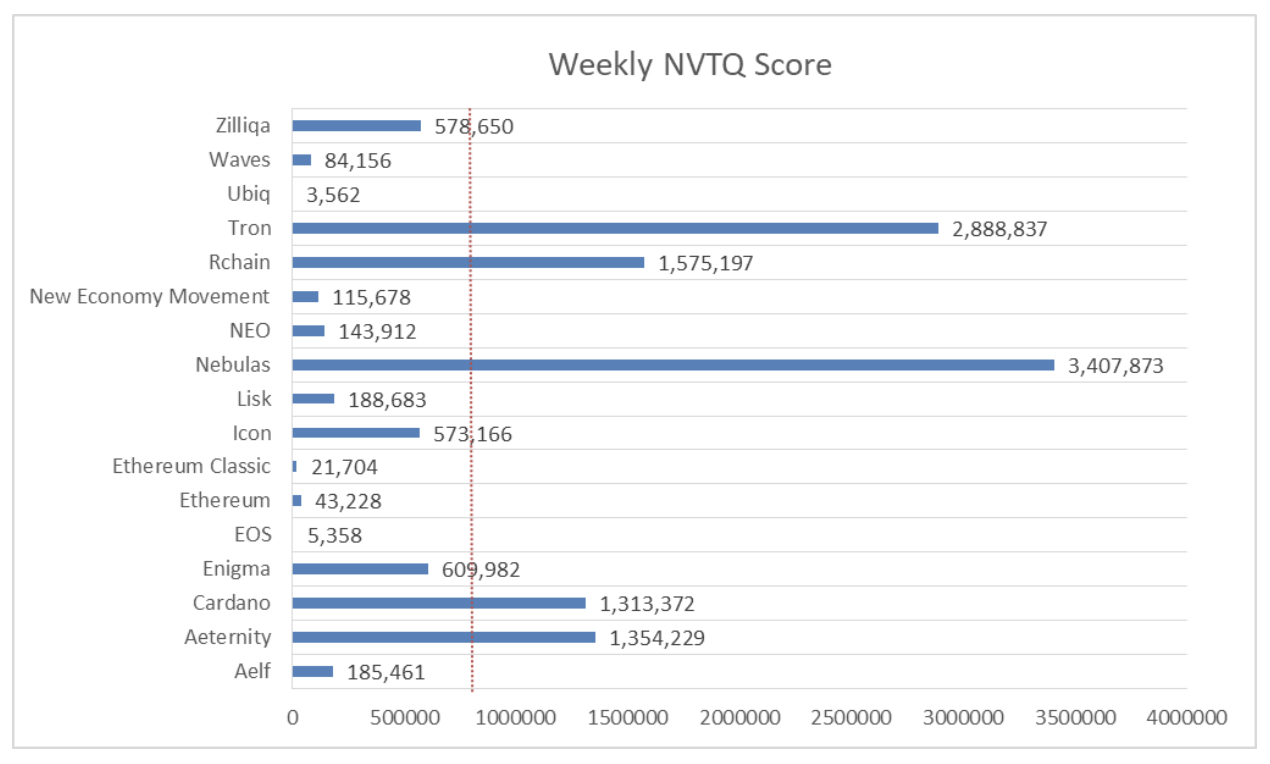
Red line signals the average NVTQ of 770,179 for all smart contract platforms.
Measuring the top 5 projects with NVTQ
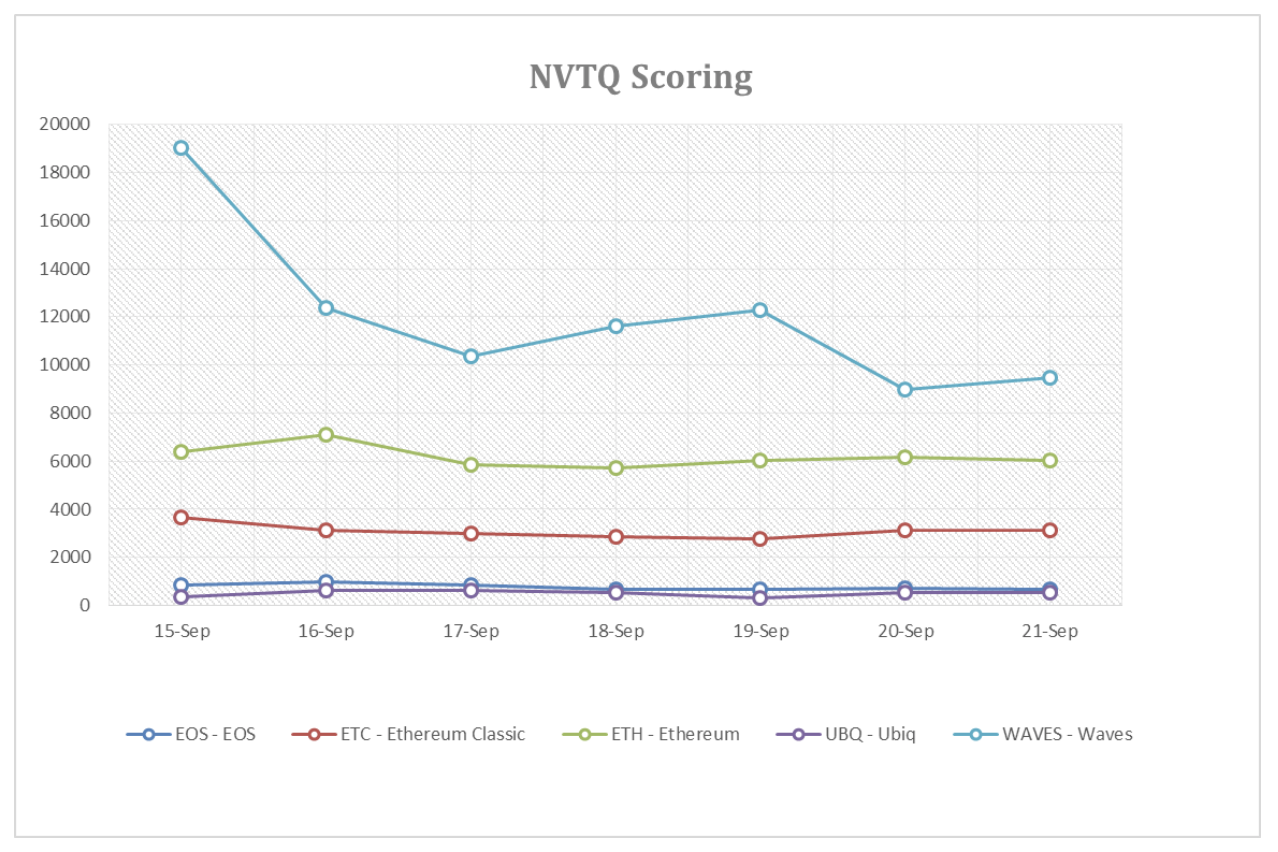
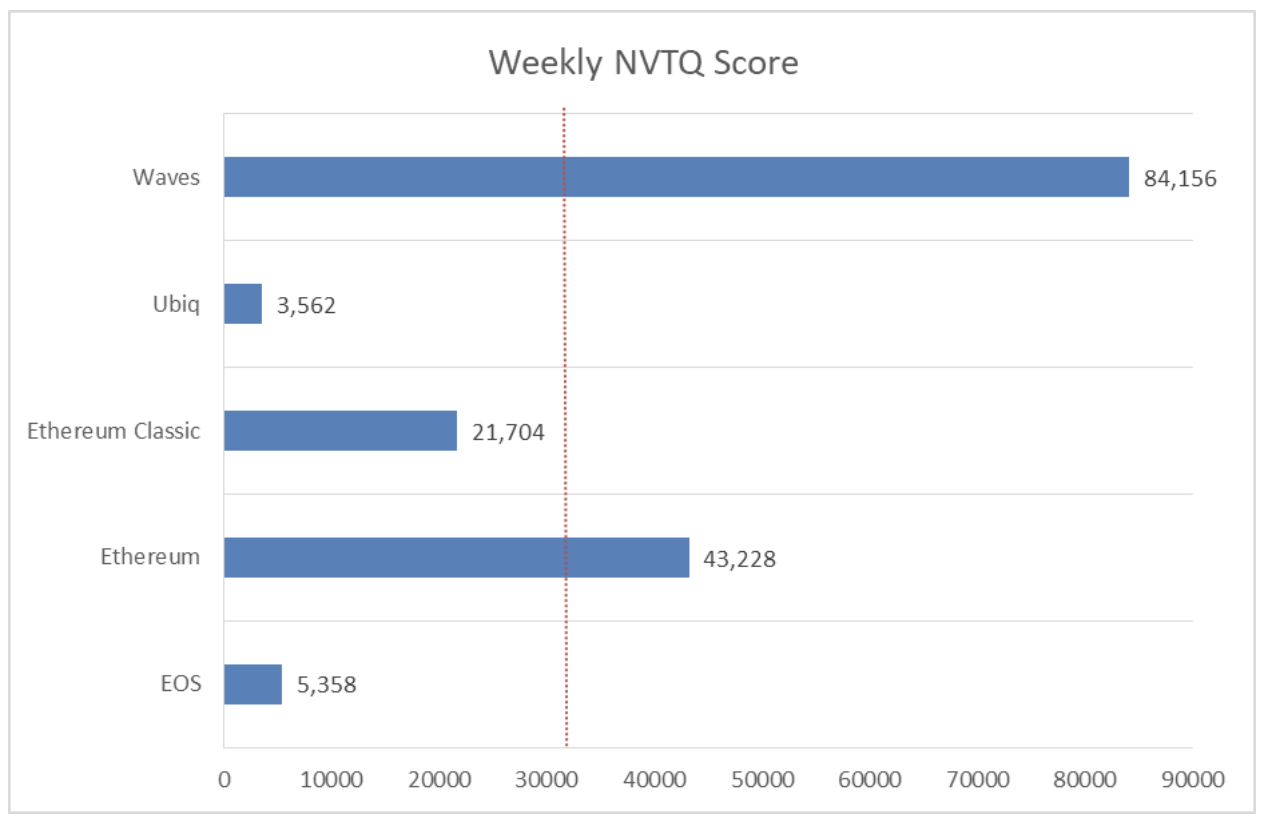
Red line signals the average NVTQ of 31,602 for the top 5 ranked (by NVTQ) platforms.
How to Interpret This Data?
While the data provides some interesting insight into the relative valuations in the crypto space, it is important to note that 2017 and early 2018 brought an unprecedented amount of money into this sector. We are in a corrective cycle and valuations may or may not be back to what we can now consider “fair-value.”
Ethereum is the longest standing smart contracts platform, and makes the perfect project to look at to see how far we are away from long term NVTQ valuations. Below is a chart monitoring the rolling 7-day NVTQ against market cap for Ethereum since its inception:
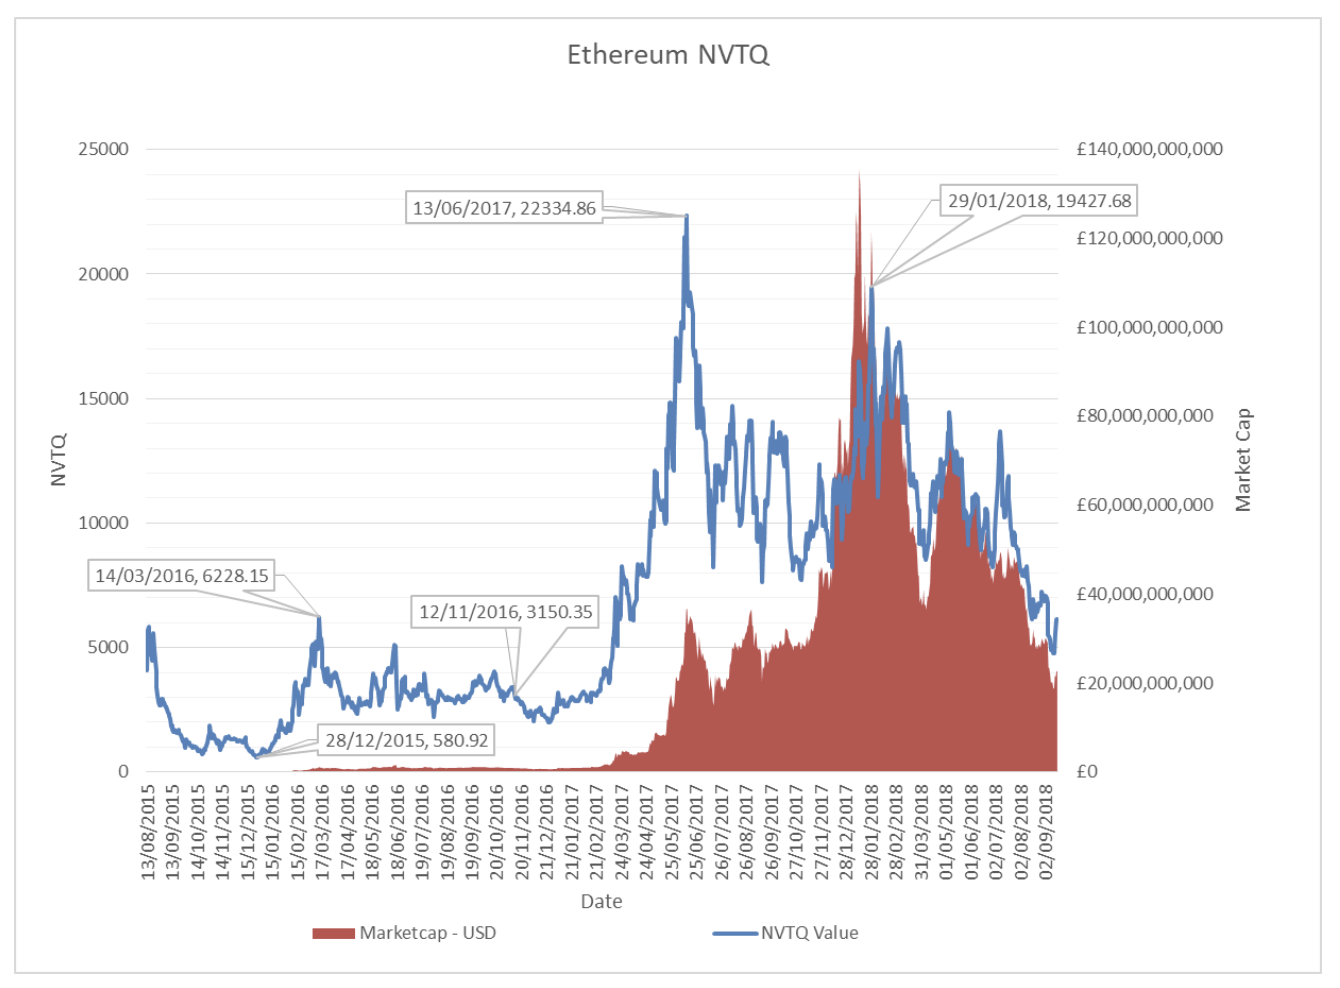
As the chart shows above, pre-2017 ICO bubble, Ethereum ranged from an NVTQ range somewhere between 580 (undervalued) to 6220 (overvalued), and then peaked at 22,334 in mid-2017 at the height of new ICOs being created.
Fair value would seem to be around the 3000 NVTQ mark pre-bubble. The question remains, what is fair value is now? Is it still around 3000 or has the game changed since the ICO craze, where much higher valuations are to be expected.
Conclusion
Some caution should be given to these results, as NVT and NVTQ is an experimental metric. However, this is a useful indicator to be considered when evaluating the various coins you can invest in.
In our research we also found evidence of some coins ‘juicing up’ their transaction activity, through the funding of bounties for dapps which were abandoned shortly after creation to juice up activity and market their coin. Transaction activity, and by extension NVTQ, is by no-means a perfect measure and a savvy investor should always do their due diligence into the long-term viability of a project. However, NVTQ is a valuable place to start when beginning this journey.
The results show a lot of activity on the EVM chains, with Ubiq demonstrating the lowest NVTQ score and therefore the most undervalued, relative to the market. It seems for now and the foreseeable future, the EVM is the standard for smart contracts platforms and is here to stay.
Contributed by Kris Lester
Kris has been working in the tech industry for over a decade, with new and innovative technologies, most recently becoming a fan of the revolutionary potential of the Blockchain. He is Ubiq’s Community Manager and a long-standing member of their community.