
- EOS continues to trade within the confines of its consolidation pattern.
- The RSI has recently dipped below 50 on EOS/USD, indicating that the market may be heading back toward support at the lower boundary of the triangle.
- Support moving forward: $5.18, $4.00, $4.73, $4.47, $4.17.
- Resistance moving forward: $5.49, $5.81, $6.07, $6.20, $6.83, $7.53, $7.90, $7.97, $8.44.
EOS has seen a recent price decline amounting to 3.02% over the last 24 hours of trading. The cryptocurrency is now trading at a price around $5.42, at the time of writing, bringing the total 7 day price movement to +0.85%.
EOS is now ranked in 5th position as it currently holds a total market cap value of around $4.89 billion, after suffering a 30-day price decline totaling 8.18%. The 16-month old coin is now trading at a price that is 74% lower than its all-time high value.
Let us continue to analyze EOS/USD and EOS/BTC over the short term, and highlight any potential areas of support and resistance moving forward.
EOS Price Analysis
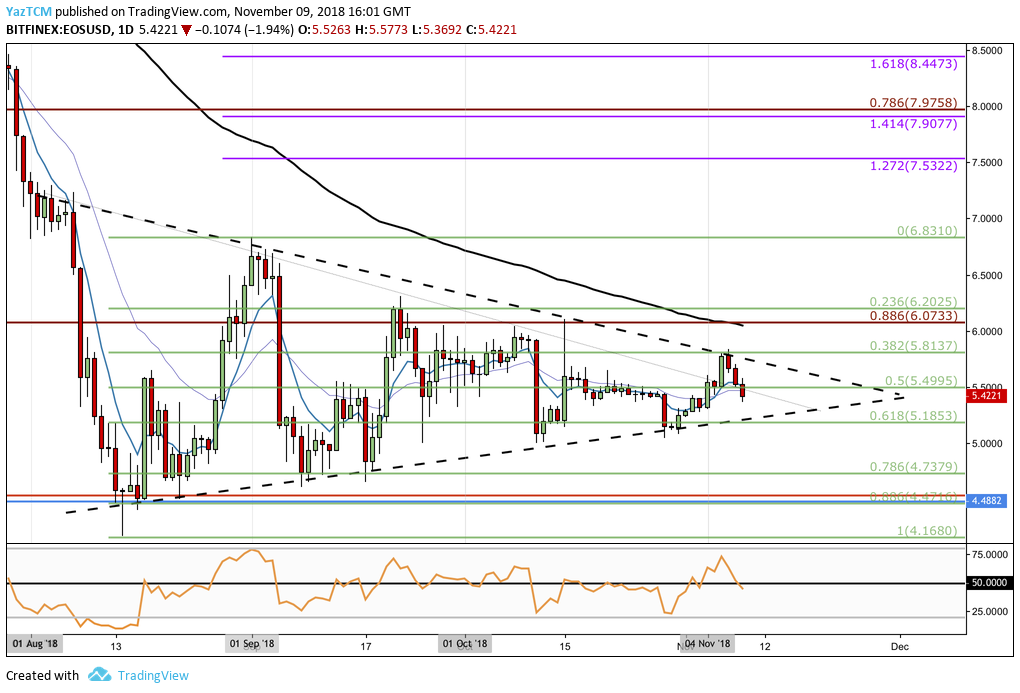
EOS/USD – SHORT TERM – DAILY CHART
For a long-term overview of EOS/USD, we recommend quickly glancing over the relevant section in our last EOS price analysis article as the long term scenario is still in play.
Taking a look at the EOS/USD market from the short-term perspective above, we can see that the market has continued to trade sideways within the symmetrical triangle pattern previously highlighted.
The market is still trapped within the range of the previous swing leg when the market began at a low of $4.17 on August 14, 2018 and rose to a high of $6.82 on September 1, 2018. This created a 62.91% increase in price.
After placing the high, the market fell until support was reached at the short-term .786 Fibonacci Retracement level (drawn in green) priced at $4.73 during September 2018. This area of support also contained the lower boundary of the symmetrical triangle, further strengthening the area and increasing the validity of the triangle.
We can also observe that price action was supported by the lower boundary of the triangle during October 2018.
The recent price surge at the start of November 2018 saw price action rise into resistance at the upper boundary of the triangle. EOS/USD was not able to penetrate above, yet again, and proceeded to reverse.
Moving forward, if the sellers continue to drive price action for EOS/USD lower, we can expect the market to find initial support below at the lower boundary of the triangle. This area of support is further bolstered by the short-term .618 Fibonacci Retracement level (drawn in green) priced at $5.18.
If the bears manage to break beneath the triangle, then further support below can be expected at the short-term .786 and .886 Fibonacci Retracement levels, priced at $4.73 and $4.47. The final level of support to highlight is located at the August 2018 low priced at $4.17.
Alternatively, in our bullish scenario, if the buyers can resume their buying spree, we can expect immediate resistance above to be located at .5 Fibonacci Retracement level (drawn in green) priced at $5.49, followed by the upper boundary of the symmetrical triangle.
If the bulls can continue to penetrate above the triangle, higher resistance can be located at the .382 Fibonacci Retracement level (drawn in green) priced at $5.81, followed by the long-term .886 Fibonacci Retracement level (drawn in red) priced at $6.07. This level of resistance also contains the 100-day moving average which adds to the strength of the resistance.
If the bulls can climb above the 100-day moving average and above the September high at $6.82, we can expect further resistance to be located at the 1.272 and 1.414 Fibonacci Extension levels (drawn in purple), priced at $7.53 and $7.90 respectively.
The RSI has recently dipped below the 50 handle which indicates that EOS/USD may travel further lower, preferably to support at the lower boundary of the triangle, before being able to create another bullish move.
Let us continue to analyze EOS/BTC over the short term.
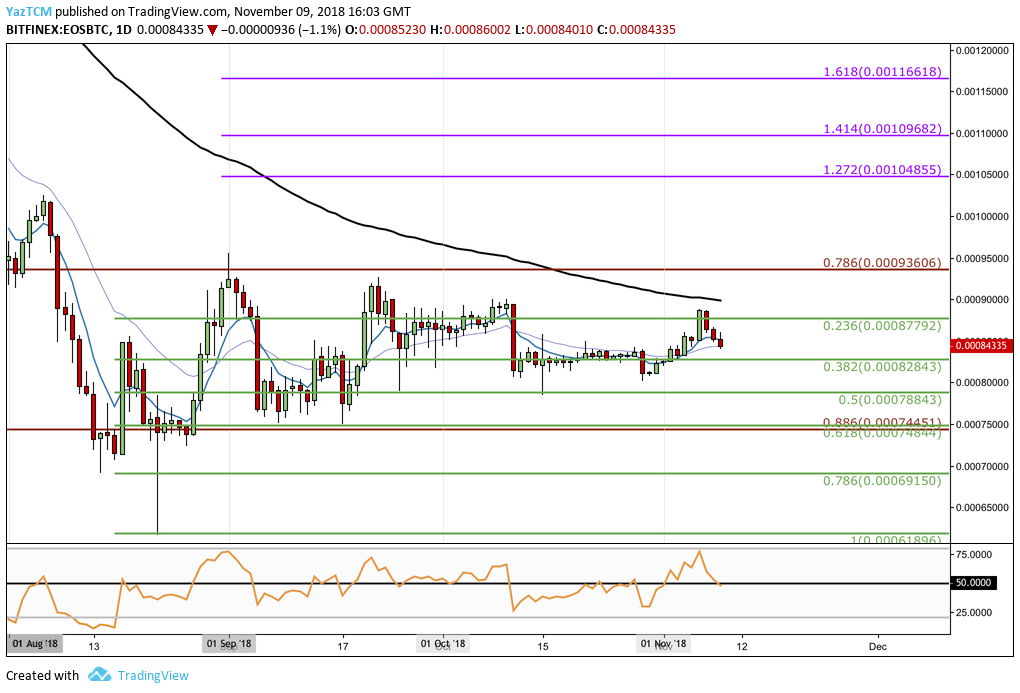
EOS/BTC – SHORT TERM – DAILY CHART
Similarly, for a long-term outline for EOS/BTC, we recommend revisiting our previous EOS analysis article.
Examining EOS/BTC from the short-term perspective above, the market had seen a 53% price surge when EOS/BTC began at a low of 61,600 SATS on August 22, 2018 and climbed to a high of 95,500 SATS on September 1, 2018.
The market then went on to drop during September 2018 until support was reached at the short-term .618 Fibonacci Retracement level (drawn in green) priced at 74,844 SATS. This level of support also contained the long-term .886 Fibonacci Retracement level (drawn in red), bolstering the strength of the support here.
The market continued to trade sideways during October 2018 as price action mainly straddled along the .382 Fibonacci Retracement level, priced at 82,843 SATS.
Moving forward, if the sellers continue to drive EOS/BTC lower, we can expect immediate support beneath to be found at the short-term .382 and .5 Fibonacci Retracement levels (drawn in green), priced at 82,843 SATS and 78,843 SATS respectively.
Further support beneath this can then be located at the .618 and .786 Fibonacci Retracement levels (drawn in green), priced at 74,844 SATS and 69,150 SATS respectively.
On the other hand, in our bullish outline, if the buyers return to the market and push EOS/BTC higher, we can expect resistance above to be located at the .236 Fibonacci Retracement level (drawn in green) priced at 87,792 SATS, followed closely by the 100-day moving average which is currently floating around the 90,000 SATS mark.
Resistance above this can then be expected at the long-term .786 Fibonacci Retracement level (drawn in red), priced at 93,606 SATS.
If the buyers can continue to climb above the September high at 95,500 SATS, we can expect higher resistance to be located at the 1.272 and 1.618 Fibonacci Extension levels (drawn in purple), priced at 104,855 SATS and 116,619 SATS respectively.
The RSI within this market is trading along the 50 handle, indicating that the previously bullish momentum has faded and that there is now a period of indecision within the EOS/BTC market. If the RSI continues below the 50 handle, this would indicate that the sellers are in control of the market momentum and price action could be heading further lower.