
October has been a turbulent month for the entire cryptocurrency industry. The month started off relatively well for the majority of altcoins in the market but this did not last long as price started to decline a few days into October 2018.
The chart below shows the total market cap value for the entire industry during October:
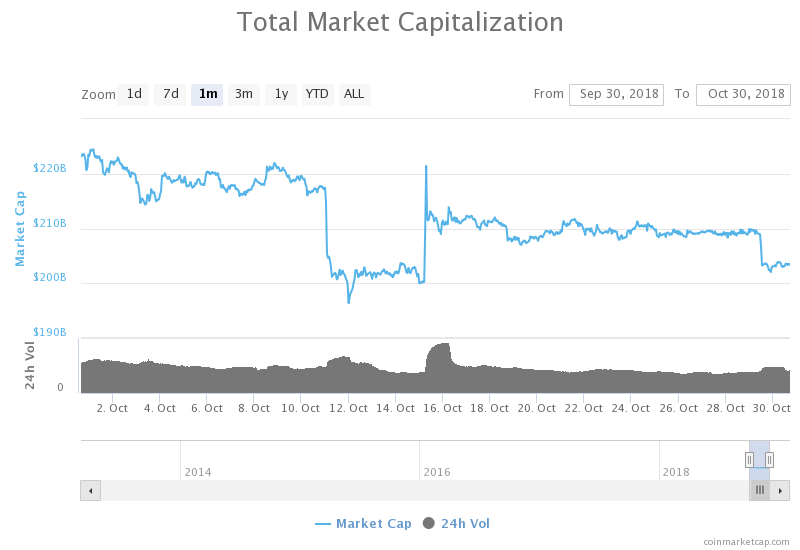
We can see that in October the market cap had started at a high of $224 billion, and closed the month $21 billion lower at $203 billion. The lowest value for October saw the market cap briefly slip beneath $200 billion to a low of $197 billion.
As we look toward a new month ahead, here are updates on 5 coins we’ve previously analyzed during October 2018, as well as information on some expected support and resistance zones for each coin.
EOS: EOS Remains Trapped Within Symmetrical Triangle
EOS/USD – SHORT TERM – DAILY CHART
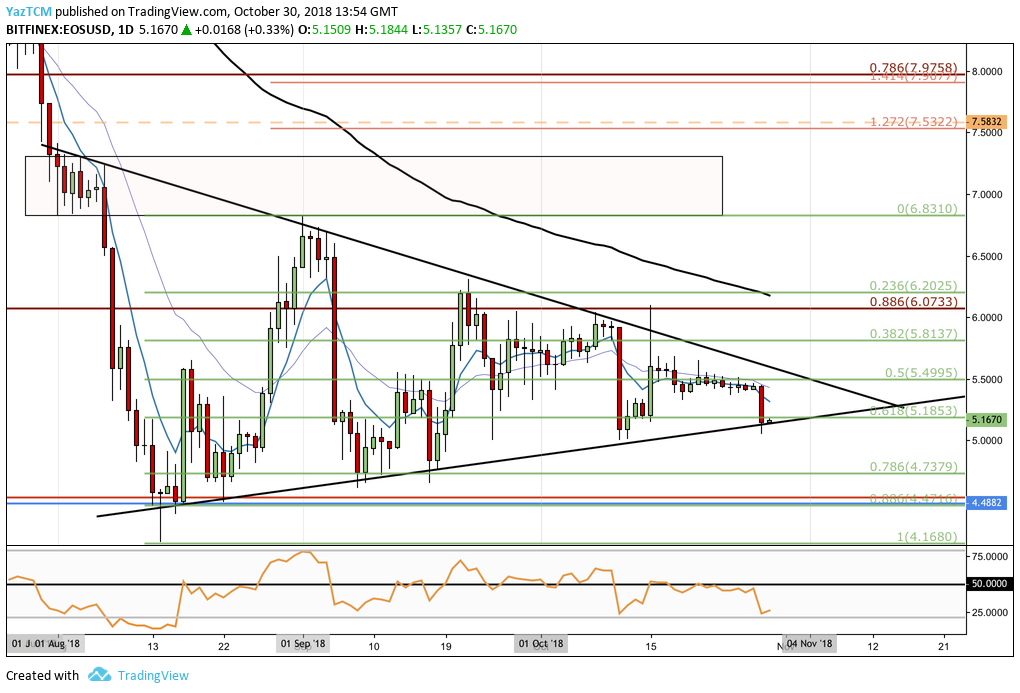
In our previous analysis of EOS, we outlined a symmetrical triangle that EOS/USD had been trading within. The EOS/USD market has continued to remain within the confines of the symmetrical triangle.
Over the course of the last 30 trading days, EOS has lost a total of 11.91%. At the time of writing, it trades at around $5.16. The 16-month old coin is in 5th position in market cap ranking, holding a total market cap of $4.66 billion.
The late-October market slump has caused price action to decline until support was found at the lower boundary of the symmetrical triangle pattern. We can also see that the support is bolstered by a short-term .618 Fibonacci Retracement level, priced in the same area at $5.18.
Looking ahead to November, in a bearish scenario, if the bears manage to pressure the market beneath the confines of the triangle, immediate support below can be expected at the short-term .786 Fibonacci Retracement level (drawn in green) priced at $4.73.
Further significant support below this will then be expected at the .886 Fibonacci Retracement level priced at $4.47. This is also the low day close price for March 2018, further adding to the expected support in this area.
Alternatively, in a bullish scenario, if the bulls can regroup their efforts to push EOS/USD higher from the lower boundary of the triangle, they will meet immediate resistance above at the .5 Fibonacci Retracement level (drawn in green) priced at $5.49, followed by the upper boundary of the symmetrical triangle.
If the bulls can break above the triangle, near-term resistance above can be located at the .382 and .236 Fibonacci Retracement levels (drawn in green), priced at $5.81 and $6.20 respectively. The resistance at $6.20 will be significant due to the 100-day moving average also being closely located within this area.
The RSI is printing an extremely negative reading for the bulls as it trades under the 50 handle. For a recovery, we would need to see RSI head back toward the 50 level.
Monero: XMR Reaches Strong Support at $100 Once Again
XMR/USD – SHORT TERM – DAILY CHART
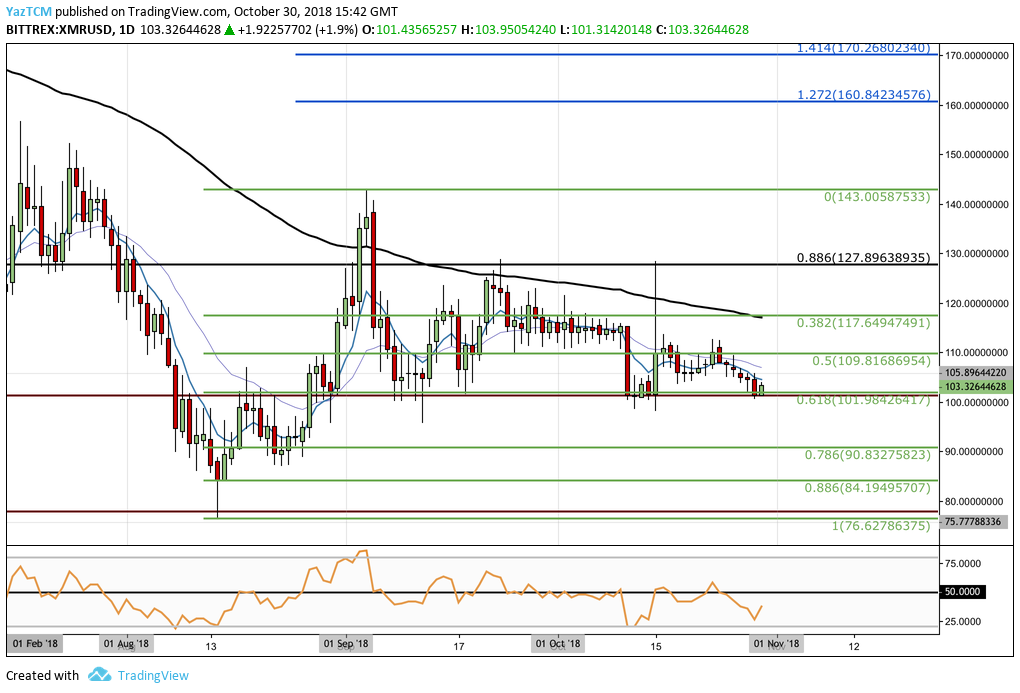
The Monero market has declined slightly since our last analysis of XMR. This is evidenced by the 30-day price decline which totals 11%. Monero presently is exchanging hands around $103, and is ranked 10th with a total market cap of $1.66 billion.
We can see that XMR/USD has slipped beneath our previously highlighted support area at the short-term .5 Fibonacci Retracement level (drawn in green) priced at $109.81. It found further expected support below, at the short-term .618 Fibonacci Retracement level (drawn in green) priced at $101.98.
This area of support is further bolstered by a long-term downside 1.272 Fibonacci Extension level priced in the same area.
Casting our gaze on the month ahead, if the bearish pressure causes the support at $101 to crumble and pushes the market below $100, further support below can be located at the short-term .786 and .886 Fibonacci Retracement levels (drawn in green), priced at $90.83 and $84.19 respectively.
Alternatively, in our bullish scenario, if the buyers can continue to buy up the support at $101 and push XMR/USD higher, they will meet initial resistance above at the short-term .5 and .382 Fibonacci Retracement levels (drawn in green), priced at $109.81 and $117.64 respectively.
The resistance at $117 is further strengthened by the 100-day moving average, hovering within the same price level.
If the bullish momentum can climb over the 100-day moving average, further resistance above can be expected at the long-term .886 Fibonacci Retracement level (drawn in black) priced at $127.89. If the bulls can then travel higher and break above the $143 handle, more resistance above can be located at the 1.272 and 1.414 Fibonacci Extension levels (drawn in blue), priced at $160 and $170 respectively.
TRON: Can the Bulls Push the TRX Market Above the April 2018 Low in November?
TRX/USD – SHORT TERM – DAILY CHART
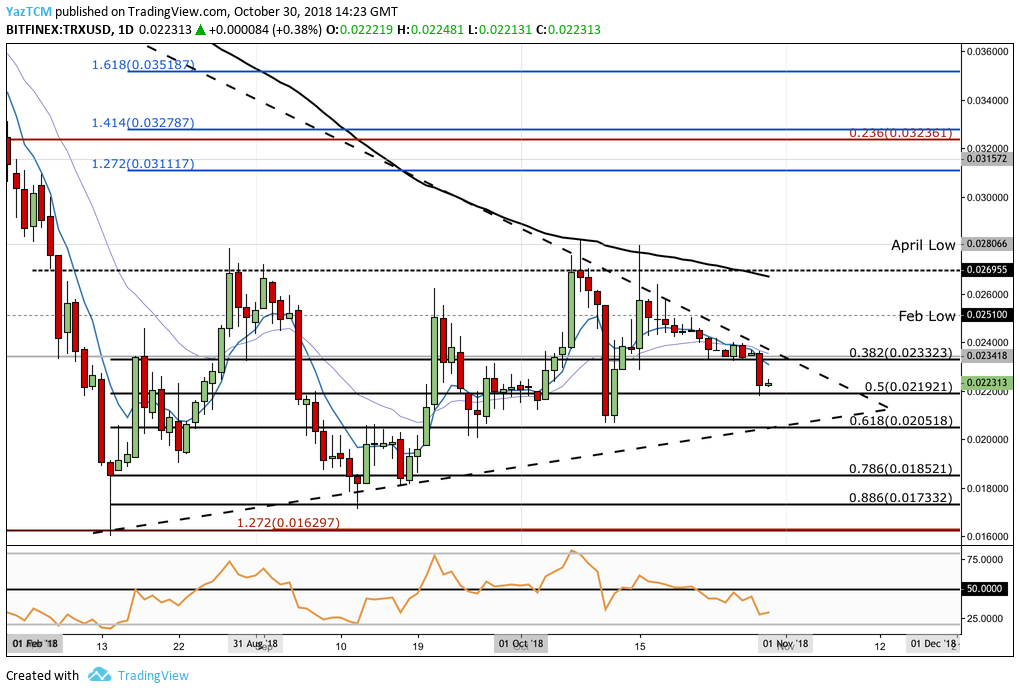
The Tronix market has continued to trade sideways since our last TRX analysis. The market has only moved a small -0.36% over the past 30 trading days, indicating the indecision within the market. Tron is ranked 11th, with a total market cap of $1.46 billion.
We can see that Tron has also started to form a symmetrical triangle pattern within its market.
We can clearly see that for the majority of October 2018, price action has been trading marginally underneath the upper boundary of the triangle. Price action attempted to break above the April 2018 low price but failed to close above as the market rolled over once again.
We can see that the sudden price drop across the industry caused TRX/USD to fall into lower support at the short-term .5 Fibonacci Retracement level priced at $0.02192.
Looking toward November 2018, if the bears continue to press TRX/USD below the support at $0.02192, further support below can be located at the short-term .618 Fibonacci Retracement level priced at $0.02051. The lower boundary of the triangle is also trading relatively close to this level of support. further bolstering this base.
If the bears continue to penetrate below the triangle, further support beneath can then be expected at the .786 and .886 Fibonacci Retracement levels, priced at $0.01852 and $0.01732 respectively.
Alternatively, in our bullish scenario, if the buyers can begin to push TRX/USD higher they will encounter immediate resistance above at the .382 Fibonacci Retracement level priced at $0.02332. This price level will require significant momentum to overcome due to the upper boundary of the triangle being closely located within the same area which adds further to the expected level of resistance.
If the bulls break above the upper boundary of the triangle, they will have to contest the February 2018 low at $0.0251, followed by the April 2018 low at $0.0280 before being able to move higher and test the $0.03 handle.
NEO: Is NEO Approaching September 2017 Lows?
NEO/USD – SHORT TERM – DAILY CHART
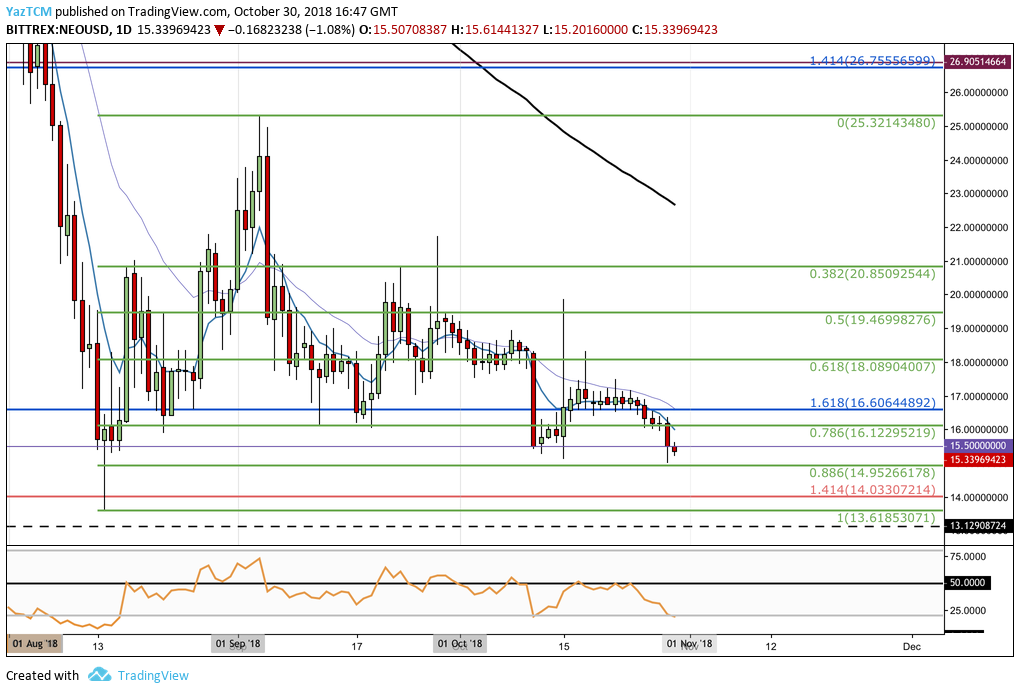
NEO/USD is another market that has been struggling since our last NEO analysis. NEO has dropped by over 19% throughout the past 30 trading days as the market currently trades around $15.33. NEO is ranked in 15th position, and presently holds a total market cap value of $996 million.
We can see that NEO/USD has recently slipped underneath our expected support at $15.50 to find further support below at the short-term .886 Fibonacci Retracement level priced at $14.95. Price action has since rebounded slightly above the $15 handle.
Projecting ahead towards the month of November, if the bearish decline continues to penetrate the market beneath the support at $14.95, we can expect immediate support beneath to be located at the downside 1.414 Fibonacci Extension level (drawn in red), priced at $14.03. Further support expected below this can be found at the August 2018 low priced at $13.61.
If the bearish momentum continues, the market will enter territory not seen for over 13 months as price action approaches the September 2017 low priced at around $13.12.
Alternatively, for the bullish scenario, if the buyers can regroup and push the market above resistance at $15.50, they will encounter higher resistance at the short-term .786 and .618 Fibonacci Retracement levels, priced at $16.12 and $18.08 respectively.
Further resistance above can then be located at the .5 and .382 Fibonacci Retracement levels, priced at $19.46 and $20.85 respectively. More significant resistance above here can be expected at the 100-day moving average which currently hovers around the $22.60 handle.
OmiseGo: Is OMG Heading Toward Fresh Yearly Lows in November?
OMG/USD – SHORT TERM – DAILY CHART
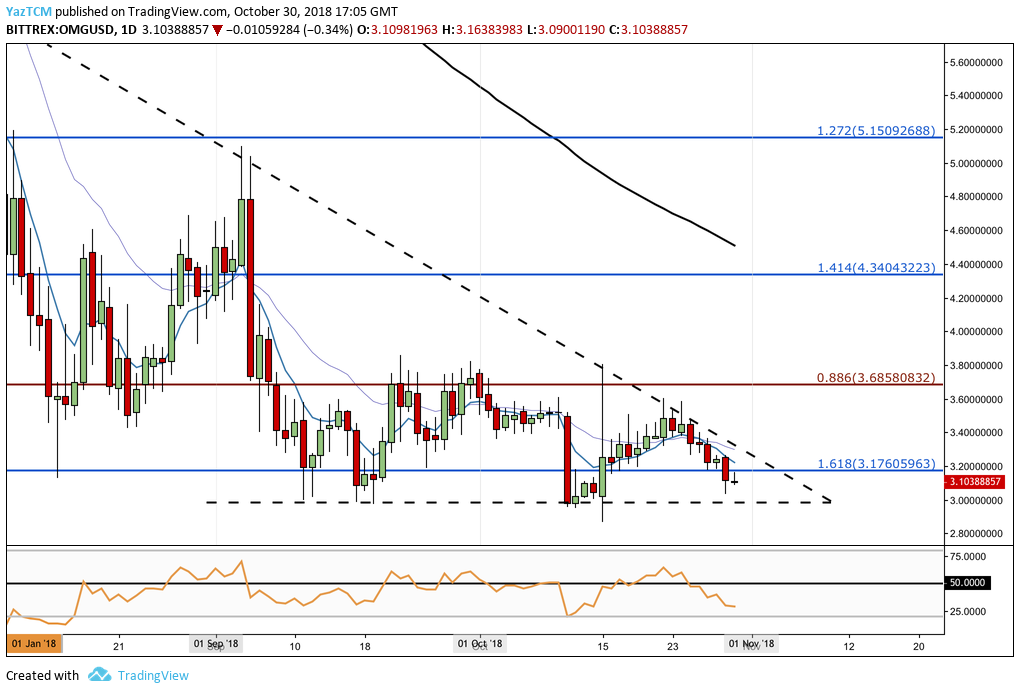
Since our last OMG analysis, price action has dipped further to find support at the outlined psychological $3.00 round number handle. The market has dropped nearly 14% over the past 30 trading days as price currently exchanges hands around $3.10. OMG is ranked in 24th position, and holds a market cap value totaling $437 million.
We can see that price action has been forming a technical triangle pattern known as a descending wedge. The bottom of the wedge is bound by the $3.00 handle and the upper boundary is a clear falling trend line.
OMG/USD has once again slipped underneath the support at the downside 1.618 Fibonacci Extension level priced at $3.17.
If the bearish momentum continues lower, we could see price action re-test the lower boundary of the descending wedge formation during November. If the bearish momentum causes OMG/USD to penetrate below the triangle, then we may see the market head lower to fresh yearly lows below $2.87.
In this extreme bearish scenario, the market could fall to a downside 1.272 Fibonacci Extension level priced at around $2.40.
Alternatively, on the bullish side, if buyers can push OMG/USD above $3.17, then they will meet initial resistance higher at the upper boundary of the descending wedge formation. If the bulls push the market above the wedge, further resistance will be expected at the long-term .886 Fibonacci Retracement level priced at $3.68, followed by psychological round number resistance at $4.00.
If the bulls succeed in their battle above $4.00, higher resistance can then be located at the previous downside 1.414 Fibonacci Extension level priced at $4.34, followed by the September 2018 high priced at $5.10.