
Since April 2013, Coinmarketcap (CMC) has been a reliable source for information about cryptocurrencies. When the website launched, only 7 cryptocurrencies were listed and one Bitcoin was only worth $135.58. Those were the days…
Through the use of API’s, CMC has been able to continuously provide up-to-date information about the total value of the crypto market, current prices of cryptocurrencies, trade volumes and much more.
For those who have never used CMC, or use it but not to it’s fullest, this article will help you get the most out of this diamond of a website.
CMC Homepage
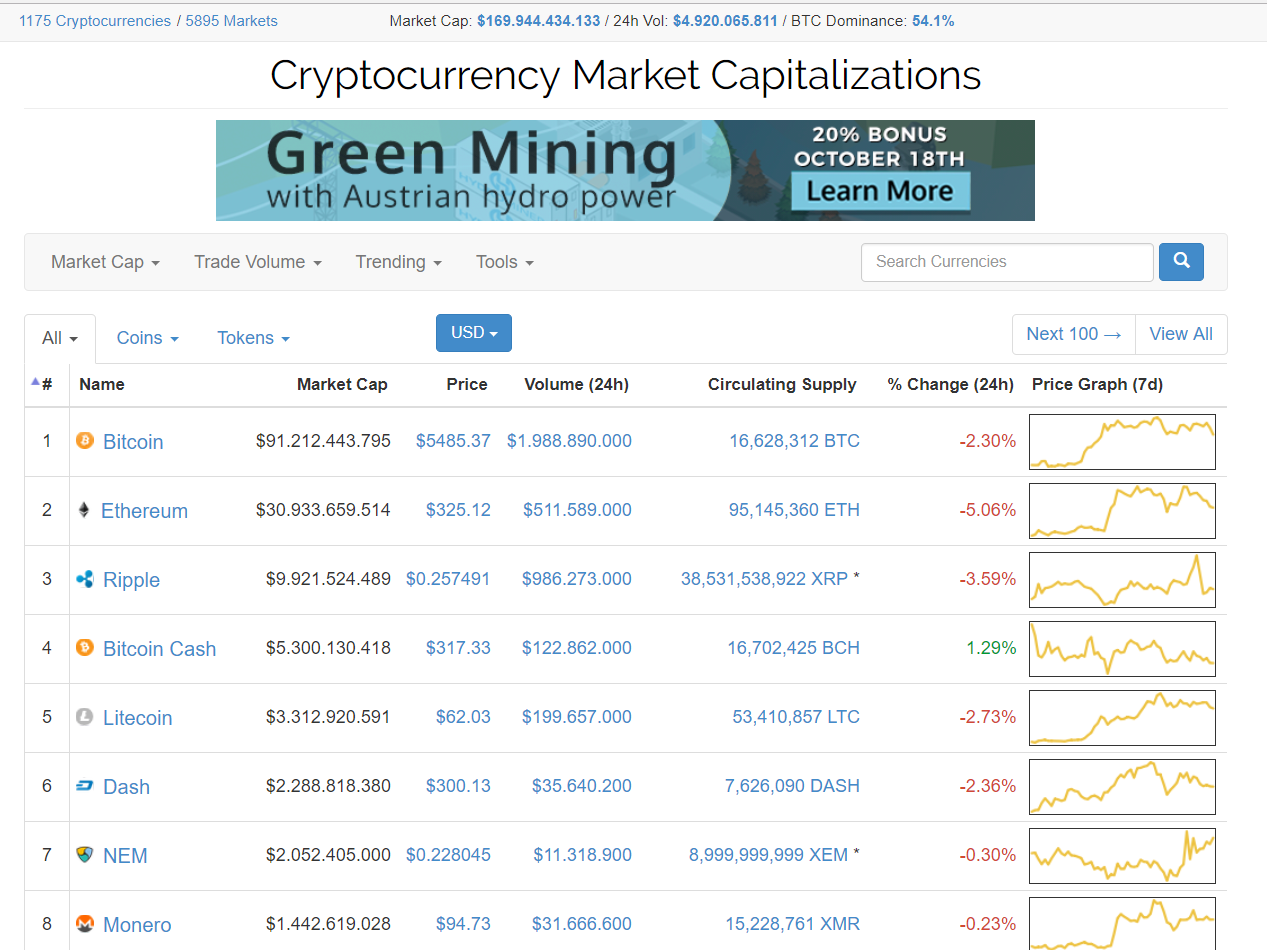
When you visit Coinmarketcap, the first thing you’ll see will be similar to the image above.
The website automatically ranks cryptocurrencies based on their market cap, which is the total (in this case US Dollar) value of a crypto. You can use the blue box (above the “Price” column) to select the currency you would like to see cryptocurrencies denominated in.
You can also see the current price of each coin and the trading volumes of the last 24 hours. The trading volumes (the column marked “Volume (24h)”) indicate how much a specific coin is being traded by investors. These volumes do not give insights on the price action of a coin — for this, look at column marked “% Change (24h)”.
Next to the “% Change (24h)” column,, we can see a simple graph of the price movement of a coin over the last 7 days.
You can also see the circulating supply of a coin. This is always important to take into account because this supply helps to determine the price of a cryptocurrency. It explains why XRP’s are so cheap while Dash is more expensive with a significantly lower market capitalization.
CMC automatically displays 100 cryptocurrencies per page, and you can use the buttons on the top right to skip to the next 100 or view all coins.
If you’re looking for the stats on a specific coin, just type the name of the company or its cryptocurrency in the search bar.
Market Cap Info

At the very top of the homepage, you can see this information bar.
At the moment of writing, there are 1175 cryptocurrencies listed on CMC and 5895 markets. These markets represent the trading pairs, so Bitcoin/Ethereum, Bitcoin/Euro, Ethereum/OMG and so on.
The total value of the crypto market is over $175 billion and nearly $5 billion has been traded in the last 24 hours. The total value of Bitcoin (BTC) represents 54.9% of the total market value, so over half of all the money in the crypto space is currently stored in Bitcoin.
Individual Page for Coins
If you search for a coin, or you click on the name of the coin in the list, you’ll end up on a page that looks like this.
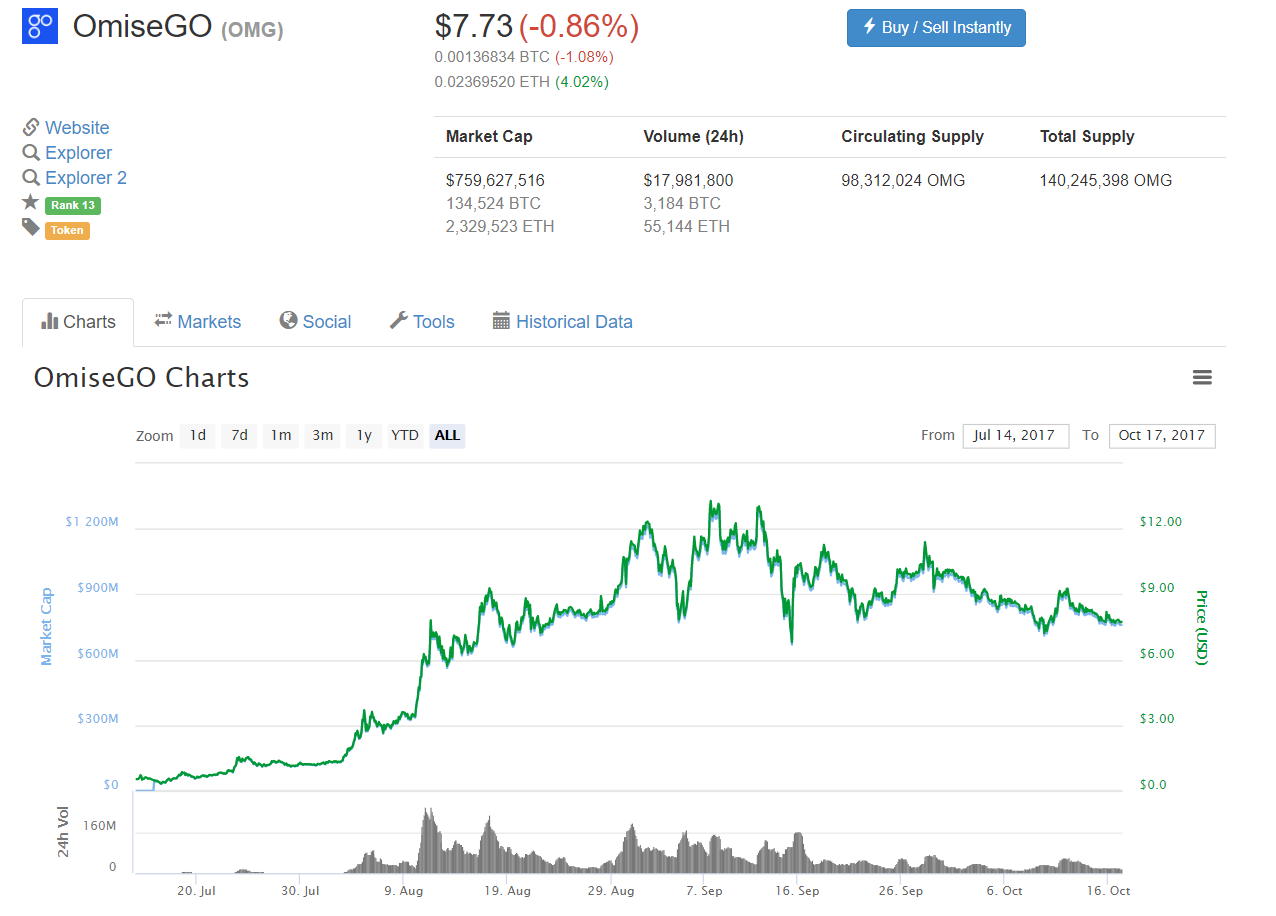
The top bar displays most of the information that can already be observed in the main listing. However, the price and price change (24h) are also expressed in Bitcoin and for Ethereum-based coins in Ethereum.
This coin-specific page, in this case the page for OMG , has a graph of the cryptocurrency since it was first sold. The X-axis represents time, and the Y-axis shows both the price and the total market cap of the cryptocurrency.
In the case of OMG, the total amount of money invested (market cap), is perfectly aligned with the price. The grey patterns below the price graph indicate the trade volumes over time.
You can use this graph to discover general price trends. Move your mouse on the graph to see the exact price at any date. To view specific time periods, you have two options. Above the graph, on the top left, there is row labeled “Zoom” which allows you to choose time periods such as 7 days or 1 month. You can also input specific dates in the date fields on the right side.
Alternatively, at the bottom of the graph is a sliding bar that allows you to select a time period.
The page has other interesting features you may find helpful.
At the top left:
Website: A direct link to the cryptocurrency’s official website
Explorer/Explorer 2: Links to additional information like announcements, technical components of the blockchain and messages.
Next to the “Charts” tab, we have:
Markets: An overview of all the exchanges on which the cryptocurrency is tradable
Social: An overview of the social media posts of the team behind a crypto, mostly focused on Twitter
Tools: Widgets and an API link which you can use for up-to-date Coinmarketcap information on your website
Historical data: An overview of the stats of a crypto for each day since its launch
Market Cap Page
If you click on “Market Cap” on the information bar on the homepage, you’re directed to the page displayed below.
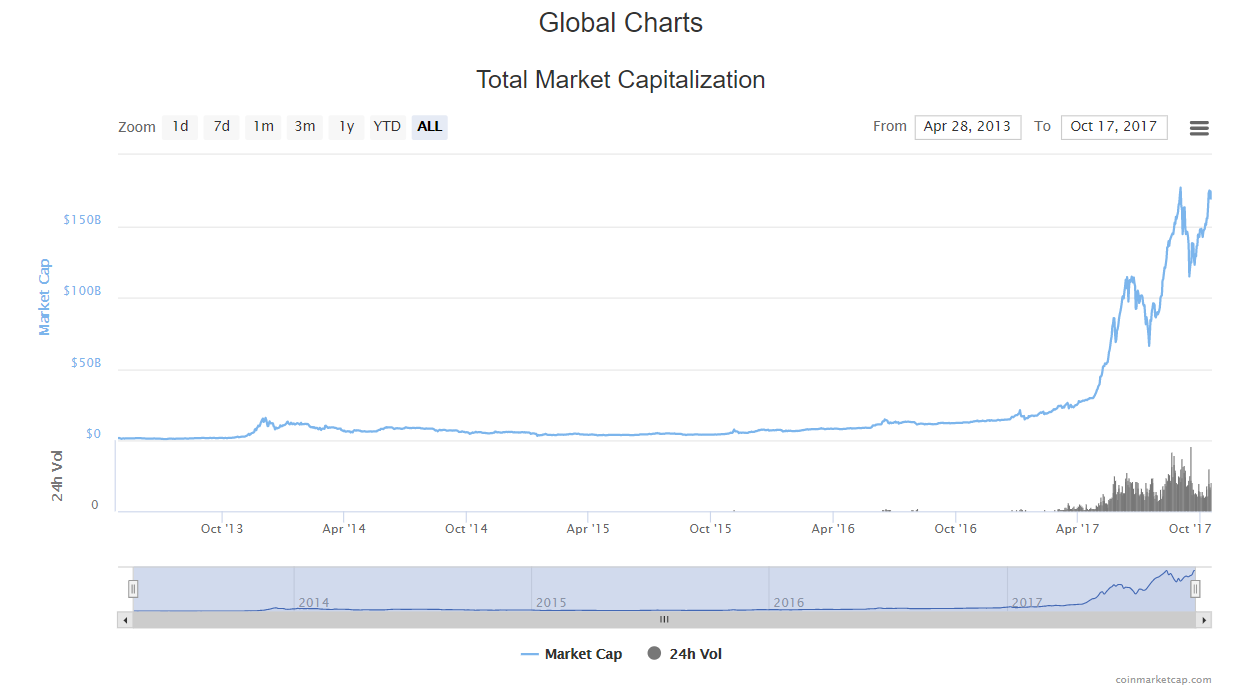
Here you can see a graph of the total value of the crypto market, the Total Market Capitalization.
If you scroll down, you’ll see a graph presenting the market value without taking Bitcoin into account.
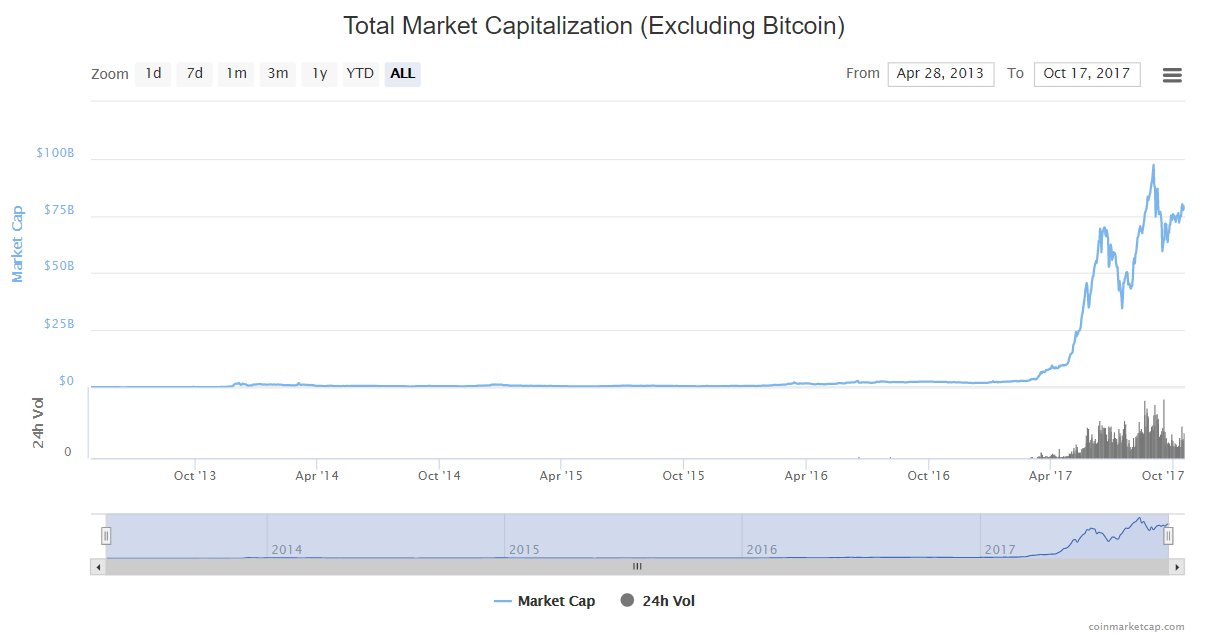
Since Bitcoin has been the dominating cryptocurrency, it can be wise to analyse the dynamics of the market without it. In the two images above, you can see that the rest of the market has been having a hard time keeping up with the price action of Bitcoin.
This is confirmed by the the third graph you’ll see on the market capitalization page.
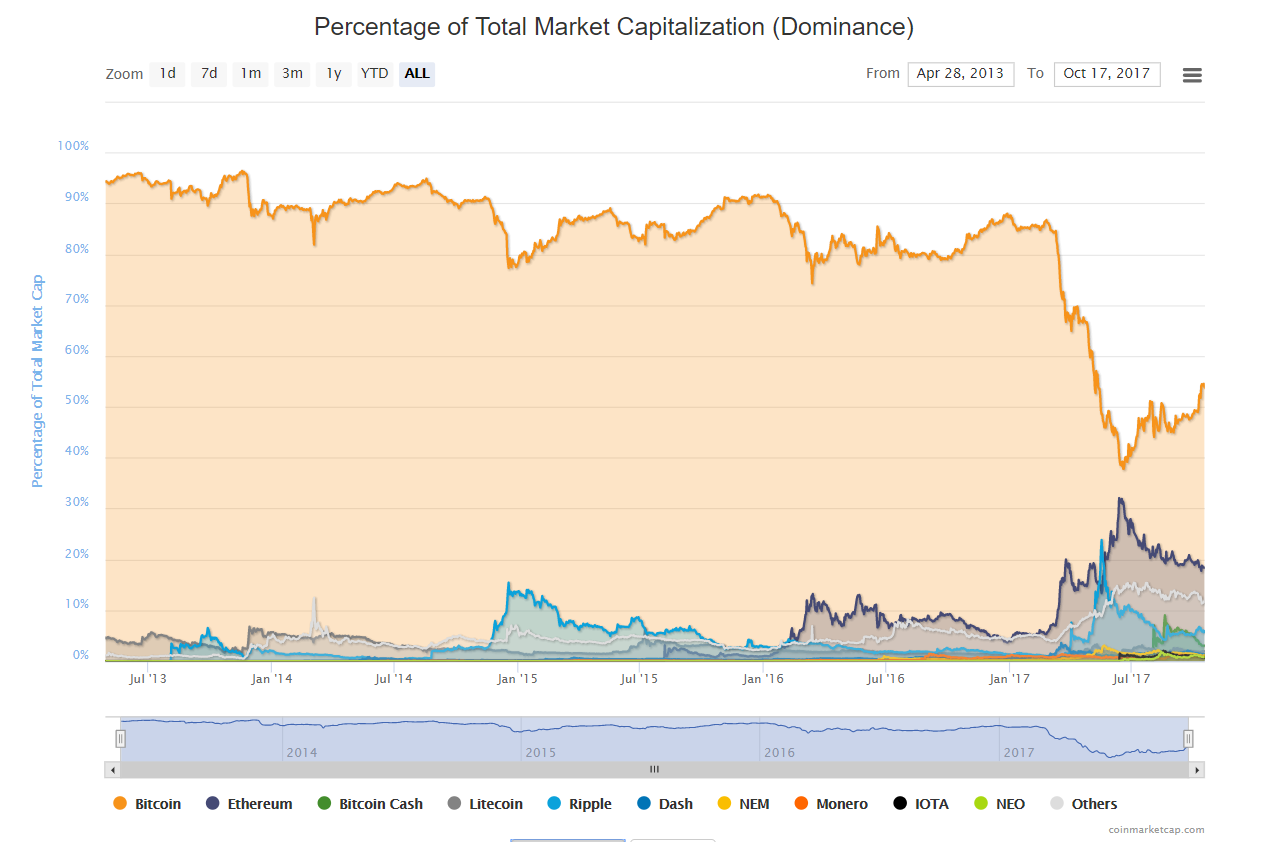
In this graph, you can observe which cryptocurrency captures what percentage value of the crypto market. The big splash of orange shows how Bitcoin has dominated the market.
Coins and Tokens
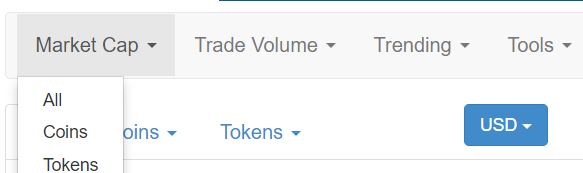
Going back to the homepage again, you can see this navigation bar above the main listing of cryptos. You can choose to see the market cap of all cryptocurrencies, or only the market caps of either Coins or Tokens.
The difference between Coins and Tokens is fairly simple. A Coin has a unique blockchain and its own digital asset in the form of a cryptocurrency, like Bitcoin and Ethereum. A Token is built on another blockchain and doesn’t have to be a currency per se.
A token can essentially represent house ownership, a vote or a chicken. To clarify, if you go to an arcade hall, the money with which you buy arcade tickets are Coins. The arcade tickets are Tokens, which you can use for a variety of products and activities.
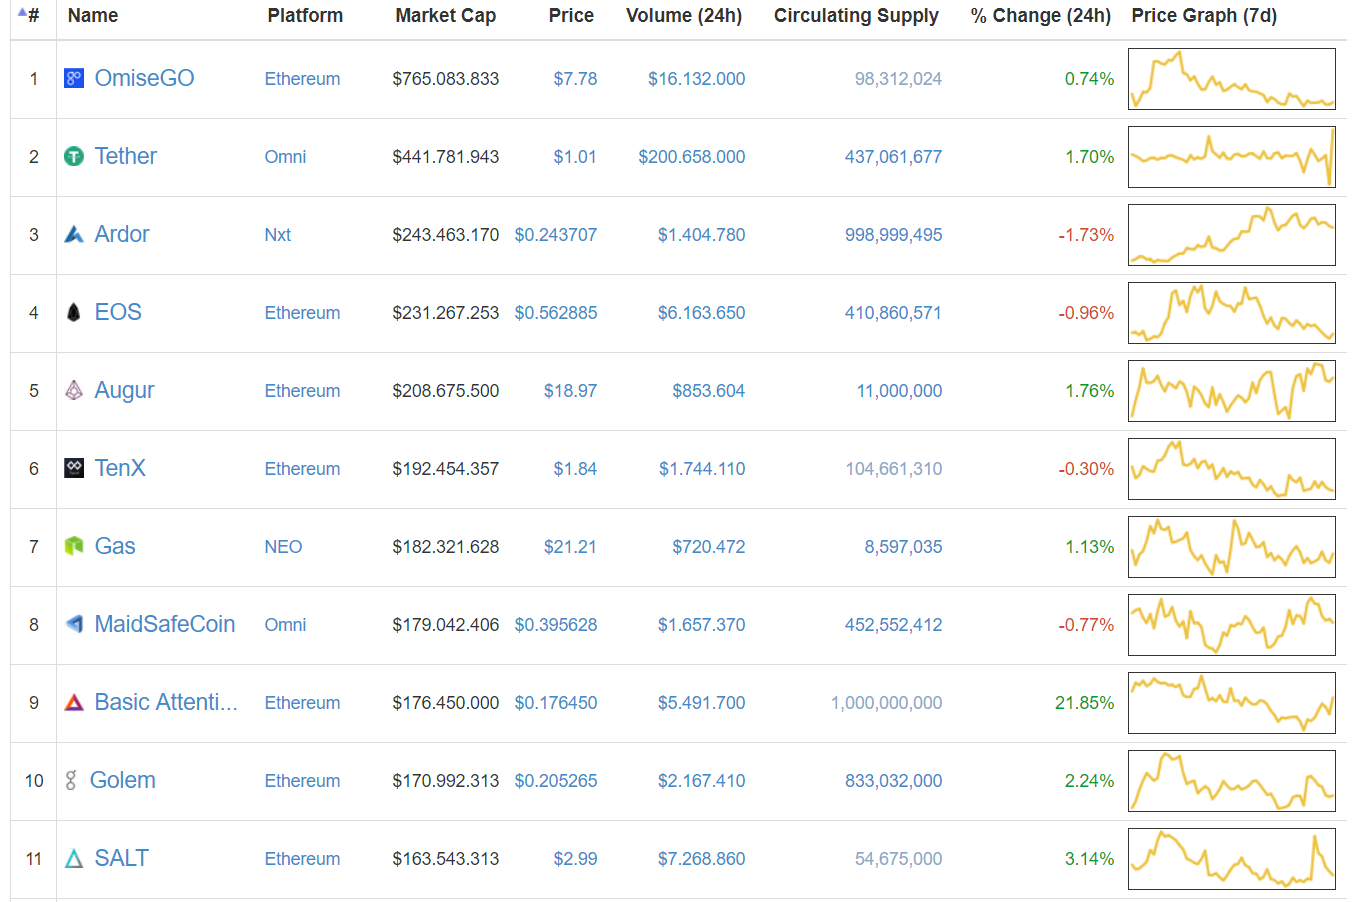
This list presents information about tokens on the market. It’s almost similar to the main listing on the homepage. The only difference is that on this page, you can see the platform on which the Token is built, thus on which coin.
Final Notes
It’s important to understand that Coinmarketcap provides a general tool for discovering the crypto space.
The prices displayed are averaged based on the prices on all the different exchanges that provide CMC with information. The price of a crypto on individual exchanges can differ quite a lot from the indicated price on Coinmarketcap.
Moreover, the graphs on CMC are simplified and most traders work with candlestick charts, which provide a lot more information on investor sentiment. Candlestick charts are provided by the exchanges themselves or by third parties.
The link to the cryptocurrency website and the social tools provided by CMC are very useful, but never forget to do your own additional research.
Finally, I’d like to thank the team behind Coinmarketcap for the incredibly useful website they’ve built. The site has taken its toll on my F5 key and has always been a great tool for navigating through the crazy world of crypto.